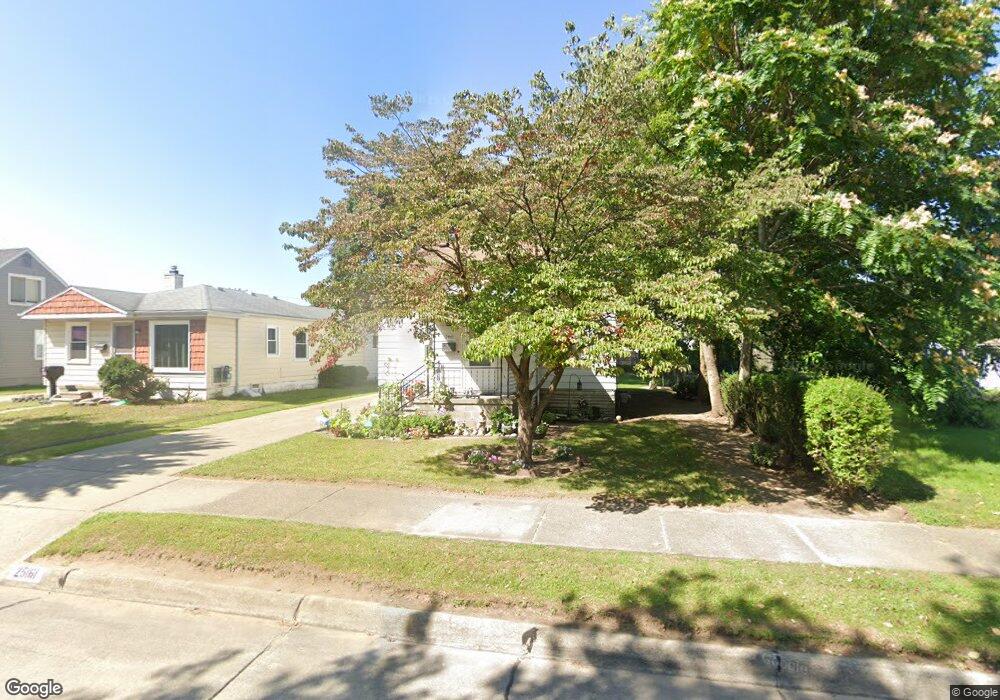
25161 Ford St Roseville, MI 48066
Estimated Value: $149,000 - $168,000
3
Beds
1
Bath
1,150
Sq Ft
$136/Sq Ft
Est. Value
About This Home
This home is located at 25161 Ford St, Roseville, MI 48066 and is currently estimated at $156,808, approximately $136 per square foot. 25161 Ford St is a home located in Macomb County with nearby schools including Dort Elementary School, Joseph G. Steenland Elementary School, and Fountain Elementary School.
Ownership History
Date
Name
Owned For
Owner Type
Purchase Details
Closed on
Dec 18, 2009
Sold by
Kaiser Steven and Kaiser Jessica
Bought by
Ciszek Edward J and Ciszek Barbara A
Current Estimated Value
Purchase Details
Closed on
May 8, 2009
Sold by
Federal National Mortgage Association
Bought by
Kaiser Steven
Purchase Details
Closed on
Aug 1, 2008
Sold by
First Horizon Home Loans
Bought by
Federal National Mortgage Association
Purchase Details
Closed on
Jun 27, 2008
Sold by
Brinning Tim and Brinning Sue
Bought by
First Horizon Home Loans
Purchase Details
Closed on
Mar 10, 2000
Sold by
Chilson Margaret V
Bought by
Brinning Tim
Home Financials for this Owner
Home Financials are based on the most recent Mortgage that was taken out on this home.
Original Mortgage
$87,800
Interest Rate
8.29%
Create a Home Valuation Report for This Property
The Home Valuation Report is an in-depth analysis detailing your home's value as well as a comparison with similar homes in the area
Home Values in the Area
Average Home Value in this Area
Purchase History
| Date | Buyer | Sale Price | Title Company |
|---|---|---|---|
| Ciszek Edward J | $55,000 | Abstract Title Agency | |
| Kaiser Steven | $1,000 | Warranty Title Agency Llc | |
| Federal National Mortgage Association | -- | None Available | |
| First Horizon Home Loans | $117,782 | None Available | |
| Brinning Tim | $87,900 | -- |
Source: Public Records
Mortgage History
| Date | Status | Borrower | Loan Amount |
|---|---|---|---|
| Previous Owner | Brinning Tim | $87,800 |
Source: Public Records
Tax History Compared to Growth
Tax History
| Year | Tax Paid | Tax Assessment Tax Assessment Total Assessment is a certain percentage of the fair market value that is determined by local assessors to be the total taxable value of land and additions on the property. | Land | Improvement |
|---|---|---|---|---|
| 2025 | $1,706 | $70,100 | $0 | $0 |
| 2024 | $905 | $62,500 | $0 | $0 |
| 2023 | $868 | $56,100 | $0 | $0 |
| 2022 | $1,523 | $49,300 | $0 | $0 |
| 2021 | $1,479 | $42,500 | $0 | $0 |
| 2020 | $844 | $38,500 | $0 | $0 |
| 2019 | $1,181 | $34,900 | $0 | $0 |
| 2018 | $1,274 | $0 | $0 | $0 |
| 2017 | $1,188 | $26,155 | $6,776 | $19,379 |
| 2016 | $1,181 | $26,155 | $0 | $0 |
| 2015 | $762 | $23,545 | $0 | $0 |
| 2013 | -- | $22,786 | $0 | $0 |
| 2011 | -- | $27,018 | $0 | $0 |
Source: Public Records
Map
Nearby Homes
- 25110 Ford St
- 16244 E 10 Mile Rd
- 25270 Ford St
- 16097 Manchester Ave
- 25289 Packard St
- 25143 Fern St
- 16106 Chesterfield Ave
- 25323 Fern St
- 25294 Wiseman St
- 25673 Ford St
- 16084 Hauss Ave
- 16086 Bell Ave
- 25239 Lehner St
- 24933 Grove Ave
- 16561 Capri Place
- 25280 Dale St
- 25135 Dale St
- 24845 Grove Ave
- 25152 Leach St
- 15738 Frazho Rd