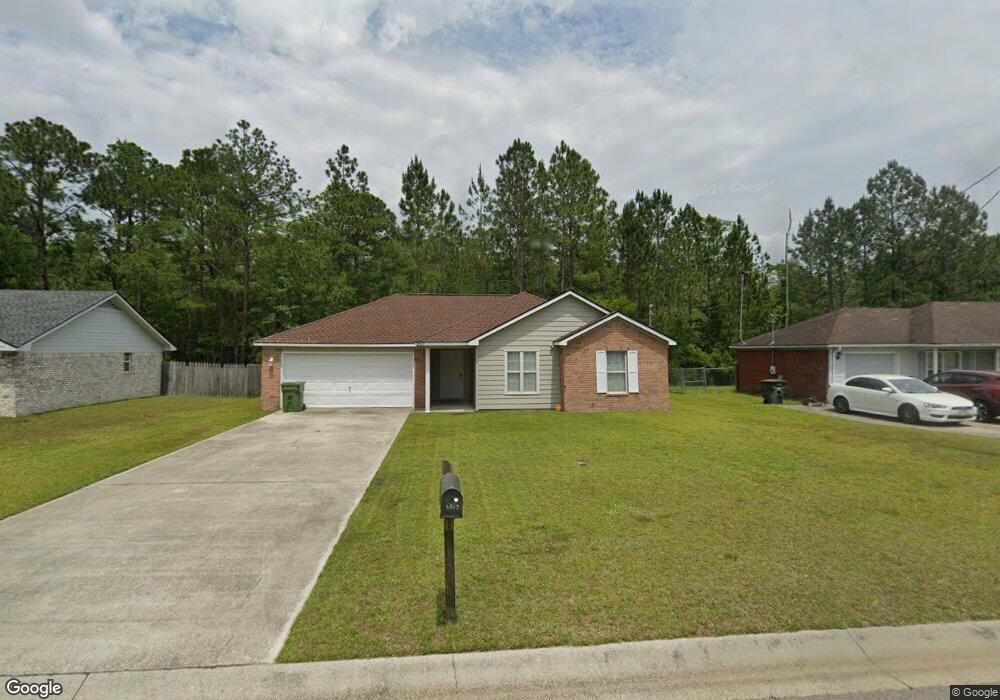
2517 Cove St Hinesville, GA 31313
Estimated Value: $183,000 - $217,000
3
Beds
2
Baths
1,086
Sq Ft
$190/Sq Ft
Est. Value
About This Home
This home is located at 2517 Cove St, Hinesville, GA 31313 and is currently estimated at $206,472, approximately $190 per square foot. 2517 Cove St is a home located in Liberty County with nearby schools including Waldo Pafford Elementary School, Lewis Frasier Middle School, and Bradwell Institute.
Ownership History
Date
Name
Owned For
Owner Type
Purchase Details
Closed on
Nov 5, 2021
Sold by
Fail Mary E
Bought by
Mason Joseph Edward
Current Estimated Value
Home Financials for this Owner
Home Financials are based on the most recent Mortgage that was taken out on this home.
Original Mortgage
$168,795
Outstanding Balance
$153,996
Interest Rate
2.99%
Mortgage Type
VA
Estimated Equity
$52,476
Purchase Details
Closed on
Sep 17, 2003
Sold by
Georgia Housing & Finance
Bought by
Fail Mary E
Purchase Details
Closed on
Nov 19, 2001
Sold by
Amey Abdul K
Bought by
Georgia Housing & Fi
Purchase Details
Closed on
Feb 6, 2001
Sold by
Georgia Housing & Fi
Bought by
Sec Of V A
Purchase Details
Closed on
Jun 5, 1997
Sold by
Monogram Constructio
Bought by
Amey Abdul K
Purchase Details
Closed on
Jan 13, 1997
Bought by
Monogram Constructio
Create a Home Valuation Report for This Property
The Home Valuation Report is an in-depth analysis detailing your home's value as well as a comparison with similar homes in the area
Home Values in the Area
Average Home Value in this Area
Purchase History
| Date | Buyer | Sale Price | Title Company |
|---|---|---|---|
| Mason Joseph Edward | $165,000 | -- | |
| Fail Mary E | -- | -- | |
| Georgia Housing & Fi | -- | -- | |
| Sec Of V A | -- | -- | |
| Georgia Housing & Finance | -- | -- | |
| Amey Abdul K | $67,000 | -- | |
| Monogram Constructio | $13,000 | -- |
Source: Public Records
Mortgage History
| Date | Status | Borrower | Loan Amount |
|---|---|---|---|
| Open | Mason Joseph Edward | $168,795 |
Source: Public Records
Tax History Compared to Growth
Tax History
| Year | Tax Paid | Tax Assessment Tax Assessment Total Assessment is a certain percentage of the fair market value that is determined by local assessors to be the total taxable value of land and additions on the property. | Land | Improvement |
|---|---|---|---|---|
| 2024 | $2,295 | $72,635 | $12,000 | $60,635 |
| 2023 | $2,295 | $65,349 | $12,000 | $53,349 |
| 2022 | $2,594 | $55,680 | $10,000 | $45,680 |
| 2021 | $1,845 | $38,750 | $8,000 | $30,750 |
| 2020 | $1,752 | $36,432 | $8,000 | $28,432 |
| 2019 | $1,661 | $34,787 | $6,000 | $28,787 |
| 2018 | $1,669 | $35,143 | $6,000 | $29,143 |
| 2017 | $1,169 | $35,498 | $6,000 | $29,498 |
| 2016 | $1,559 | $34,432 | $6,000 | $28,432 |
| 2015 | $1,729 | $34,432 | $6,000 | $28,432 |
| 2014 | $1,729 | $37,826 | $8,000 | $29,826 |
| 2013 | -- | $36,586 | $8,000 | $28,586 |
Source: Public Records
Map
Nearby Homes
- 0 Airport Rd Unit 325633
- 2563 Zachary Ct
- 2716 Java Ct
- 269 Brightleaf Cir
- 851 Lyndsi Ln
- 1.17 ACRES Elam Rd
- 225 Rendell Ln
- 307 Lumpkin Ln
- 201 Slayton Cir
- 303 Camden Ct
- 104 Shallowford Cir
- 302 Largo Ct
- 164 Glynn Ct
- 776 Burnt Pines Rd NE
- 33 Bryan Way
- 1802 White Cedar Way
- 1295 Windrow Dr
- 1596 Longleaf Ct
- 1302 Loblolly Dr
- 1240 Pineridge Way
- 2515 Cove St
- 2519 Cove St
- 2513 Cove St
- 2516 Cove St
- 2518 Cove St
- 2514 Cove St
- 2523 Cove St
- 2511 Cove St
- 2520 Cove St
- 2512 Cove St
- 2522 Cove St
- 2541 Parkland Blvd
- 2543 Parkland Blvd
- 2524 Cove St
- 2545 Parkland Blvd
- 2526 Cove St
- 2747 Ga Highway 196 W
- 2547 Parkland Blvd
- 2549 Parkland Blvd
- 2540 Parkland Blvd