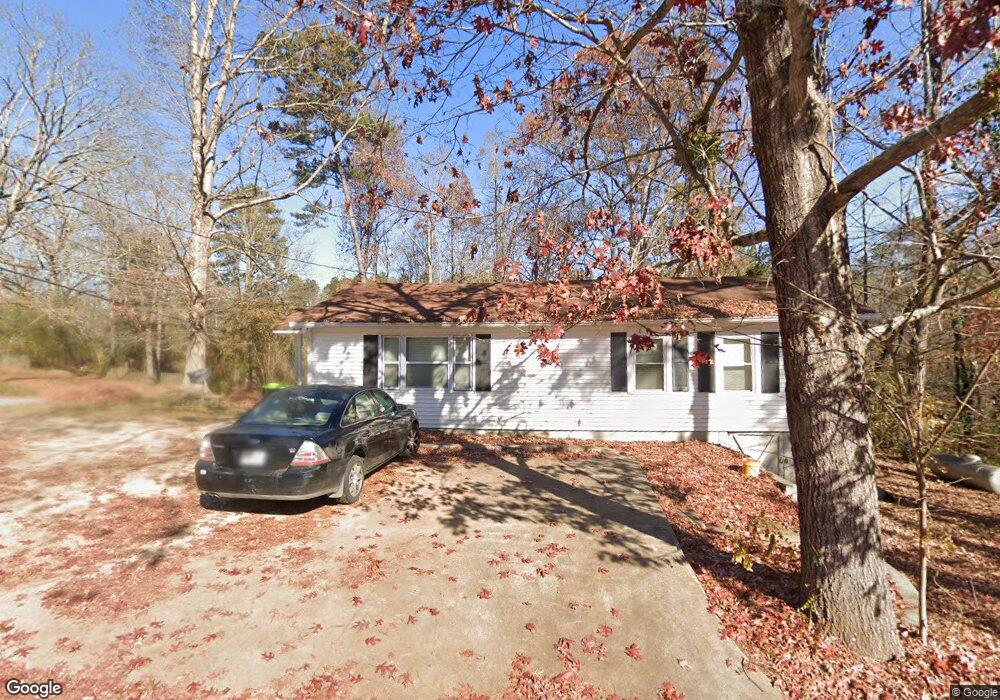
2517 Hi Roc Cir NE Conyers, GA 30012
Estimated Value: $181,000 - $234,000
3
Beds
1
Bath
1,336
Sq Ft
$155/Sq Ft
Est. Value
About This Home
This home is located at 2517 Hi Roc Cir NE, Conyers, GA 30012 and is currently estimated at $206,860, approximately $154 per square foot. 2517 Hi Roc Cir NE is a home located in Rockdale County with nearby schools including Hightower Trail Elementary School, Conyers Middle School, and Rockdale County High School.
Ownership History
Date
Name
Owned For
Owner Type
Purchase Details
Closed on
Nov 19, 2014
Sold by
The Peoples Bank
Bought by
Christian Timothy Joe
Current Estimated Value
Home Financials for this Owner
Home Financials are based on the most recent Mortgage that was taken out on this home.
Original Mortgage
$28,000
Outstanding Balance
$21,409
Interest Rate
3.95%
Mortgage Type
New Conventional
Estimated Equity
$185,451
Purchase Details
Closed on
Nov 5, 2013
Sold by
Horner Kenneth J
Bought by
The Peoples Bank
Purchase Details
Closed on
Mar 25, 2004
Sold by
Magnusson Ray
Bought by
Horner Kenneth J and Horner Kimberly
Home Financials for this Owner
Home Financials are based on the most recent Mortgage that was taken out on this home.
Original Mortgage
$76,800
Interest Rate
5.53%
Mortgage Type
New Conventional
Purchase Details
Closed on
Apr 26, 1993
Sold by
Gober Mary E
Bought by
Kucheryavyy Vasiliy and Kucheryavyy Katherine
Create a Home Valuation Report for This Property
The Home Valuation Report is an in-depth analysis detailing your home's value as well as a comparison with similar homes in the area
Home Values in the Area
Average Home Value in this Area
Purchase History
| Date | Buyer | Sale Price | Title Company |
|---|---|---|---|
| Christian Timothy Joe | $35,000 | -- | |
| The Peoples Bank | $98,171 | -- | |
| Horner Kenneth J | $96,000 | -- | |
| Kucheryavyy Vasiliy | $24,000 | -- |
Source: Public Records
Mortgage History
| Date | Status | Borrower | Loan Amount |
|---|---|---|---|
| Open | Christian Timothy Joe | $28,000 | |
| Previous Owner | Horner Kenneth J | $76,800 | |
| Closed | Kucheryavyy Vasiliy | -- |
Source: Public Records
Tax History Compared to Growth
Tax History
| Year | Tax Paid | Tax Assessment Tax Assessment Total Assessment is a certain percentage of the fair market value that is determined by local assessors to be the total taxable value of land and additions on the property. | Land | Improvement |
|---|---|---|---|---|
| 2024 | $2,949 | $73,280 | $15,520 | $57,760 |
| 2023 | $2,534 | $60,960 | $11,600 | $49,360 |
| 2022 | $2,300 | $55,080 | $13,600 | $41,480 |
| 2021 | $1,795 | $42,960 | $7,600 | $35,360 |
| 2020 | $1,669 | $39,160 | $7,600 | $31,560 |
| 2019 | $1,368 | $30,480 | $4,800 | $25,680 |
| 2018 | $1,300 | $28,840 | $3,600 | $25,240 |
| 2017 | $816 | $17,920 | $3,600 | $14,320 |
| 2016 | $816 | $17,920 | $3,600 | $14,320 |
| 2015 | $638 | $14,000 | $3,103 | $10,897 |
| 2014 | $615 | $13,360 | $2,800 | $10,560 |
| 2013 | -- | $19,320 | $4,800 | $14,520 |
Source: Public Records
Map
Nearby Homes
- 2483 Hi Roc Cir NE
- 2488 Hi Roc Cir NE
- 2435 Hi Roc Cir NE
- 2392 Lakeshore Dr NE
- 2390 Trailwood Dr
- 2569 Pinewood Dr NE
- 2399 Philadelphia Rd NE
- 0 Lakewood Way NE Unit 10425723
- 0 Lakewood Way NE Unit 637 20146199
- 0 Lakewood Way NE Unit 7483355
- 000 Lakewood Way NE
- 00 Lakewood Way NE
- 0 Lakewood Way NE Unit 621 20146202
- 2556 Winding Lake Trail NE
- 2531 Hill Cir NE
- 2405 Hi Roc Cir NE
- 2331 Leafway Trail NE
- 2635 Twin Oaks Dr NE
- 2643 Twin Oaks Dr NE
- 2533 Philadelphia Rd
- 2525 Hi Roc Cir NE
- 0 Wye Dr NE Unit 7467254
- 2510 Wye Dr NE
- 2516 Wye Dr NE
- 2518 Hi Roc Cir NE
- 2526 Hi Roc Cir NE
- 2560 Hi Roc Cir NE
- 2526 Wye Dr NE
- 2507 Hi Roc Cir NE
- 2504 Hi Roc Cir NE
- 2534 Hi Roc Cir NE
- 2549 Hi Roc Cir NE
- 2443 Lakeshore Dr NE
- 2546 Wye Dr NE
- 2452 Lakeshore Dr NE
- 2495 Lucas Dr NE
- 2550 Hi Roc Cir NE
- 2439 Lakeshore Dr NE
- 2480 Hi Roc Cir NE
- 2063 Parkview Ct NE