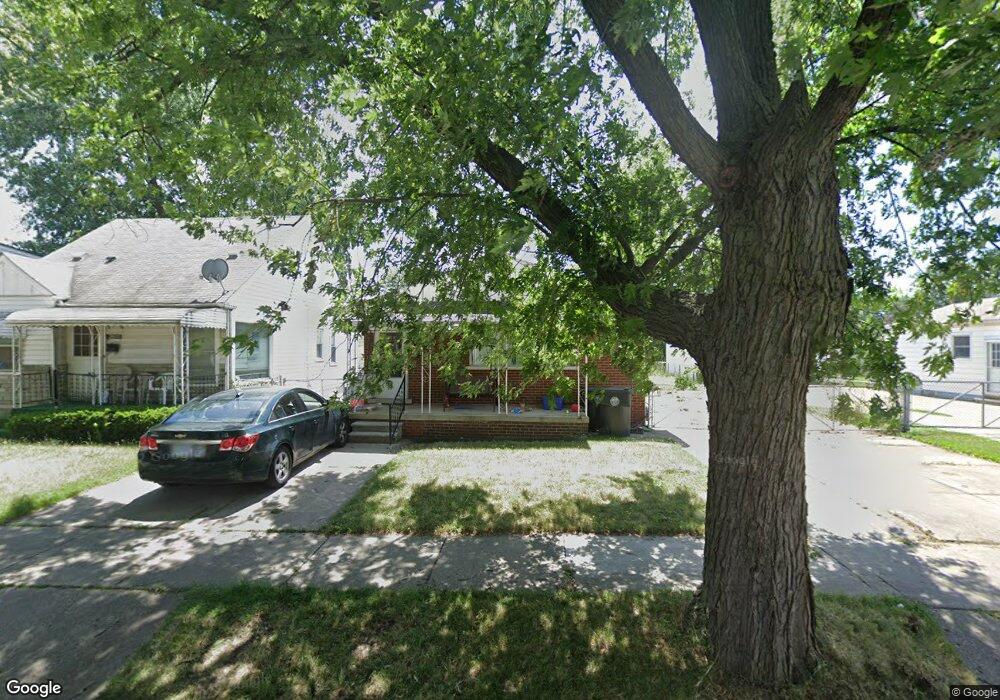
2517 Norman St Melvindale, MI 48122
Estimated Value: $125,134 - $143,000
--
Bed
1
Bath
960
Sq Ft
$139/Sq Ft
Est. Value
About This Home
This home is located at 2517 Norman St, Melvindale, MI 48122 and is currently estimated at $133,284, approximately $138 per square foot. 2517 Norman St is a home located in Wayne County with nearby schools including Rogers Early Elementary School, Allendale Elementary School, and Julian O. Strong Middle School.
Ownership History
Date
Name
Owned For
Owner Type
Purchase Details
Closed on
Oct 3, 2014
Sold by
Thornton Francis W
Bought by
Thornton Kelly and Moore Ralph James
Current Estimated Value
Purchase Details
Closed on
Jul 1, 2010
Sold by
Mabe Hodge Deborah Ann and Thornton Francis William
Bought by
Thornton Francis W and Thornton Kelly Ann
Purchase Details
Closed on
Nov 14, 2005
Sold by
Mabe Hodge Deborah Ann and Thornton Francis William
Bought by
Fillenworth Paul Franklin
Purchase Details
Closed on
Feb 15, 2005
Sold by
Fillenworth Paul Franklin and Fillenworth Athelene Mae
Bought by
Mabe Hodge Deborah Ann
Create a Home Valuation Report for This Property
The Home Valuation Report is an in-depth analysis detailing your home's value as well as a comparison with similar homes in the area
Home Values in the Area
Average Home Value in this Area
Purchase History
| Date | Buyer | Sale Price | Title Company |
|---|---|---|---|
| Thornton Kelly | -- | Attorney | |
| Thornton Francis W | -- | None Available | |
| Fillenworth Paul Franklin | -- | None Available | |
| Mabe Hodge Deborah Ann | -- | Minnesota Title Agency |
Source: Public Records
Tax History Compared to Growth
Tax History
| Year | Tax Paid | Tax Assessment Tax Assessment Total Assessment is a certain percentage of the fair market value that is determined by local assessors to be the total taxable value of land and additions on the property. | Land | Improvement |
|---|---|---|---|---|
| 2025 | $1,569 | $61,100 | $0 | $0 |
| 2024 | $1,569 | $51,200 | $0 | $0 |
| 2023 | $1,508 | $48,500 | $0 | $0 |
| 2022 | $2,399 | $43,600 | $0 | $0 |
| 2021 | $2,324 | $37,900 | $0 | $0 |
| 2020 | $2,311 | $29,500 | $0 | $0 |
| 2019 | $2,167 | $27,500 | $0 | $0 |
| 2018 | $1,466 | $26,700 | $0 | $0 |
| 2017 | $1,273 | $27,500 | $0 | $0 |
| 2016 | $2,057 | $26,700 | $0 | $0 |
| 2015 | $2,360 | $23,600 | $0 | $0 |
| 2013 | $2,380 | $24,900 | $0 | $0 |
| 2012 | $1,647 | $24,200 | $3,800 | $20,400 |
Source: Public Records
Map
Nearby Homes