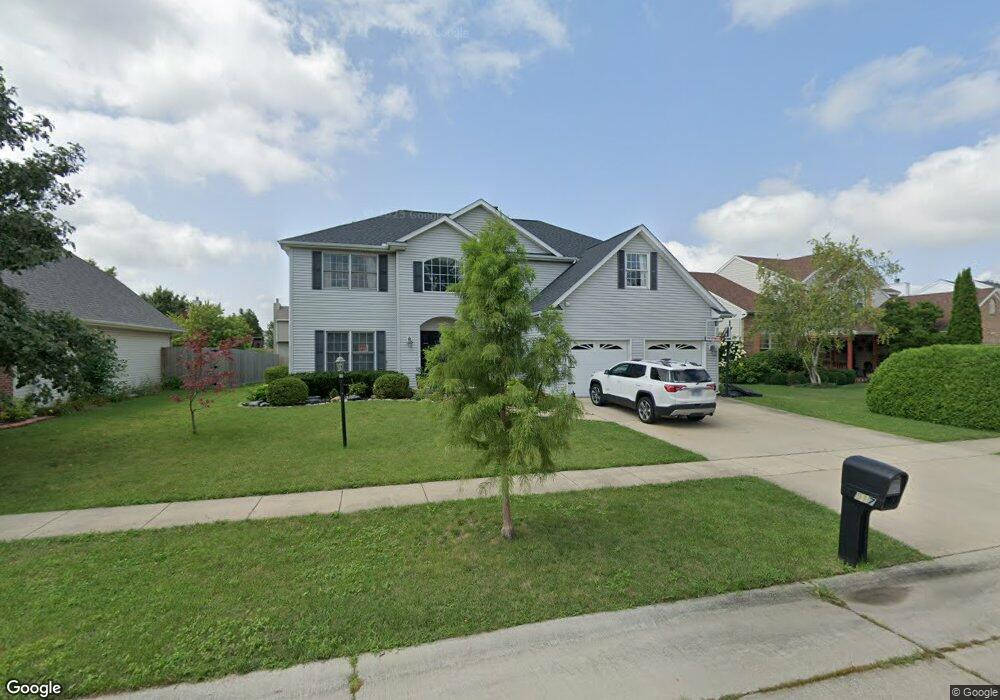
2517 Pinehurst Dr Unit 1 Champaign, IL 61822
Cherry Hills NeighborhoodEstimated Value: $453,675 - $477,000
4
Beds
3
Baths
3,010
Sq Ft
$155/Sq Ft
Est. Value
About This Home
This home is located at 2517 Pinehurst Dr Unit 1, Champaign, IL 61822 and is currently estimated at $467,169, approximately $155 per square foot. 2517 Pinehurst Dr Unit 1 is a home located in Champaign County with nearby schools including Central High School, Montessori School of Champaign-Urbana, and Next Generation School.
Ownership History
Date
Name
Owned For
Owner Type
Purchase Details
Closed on
Dec 31, 2012
Sold by
Lamm Kenneth H and Lamm Barbara A
Bought by
Wyeth Robert K and Wyeth Frances M
Current Estimated Value
Home Financials for this Owner
Home Financials are based on the most recent Mortgage that was taken out on this home.
Original Mortgage
$256,500
Outstanding Balance
$178,345
Interest Rate
3.37%
Mortgage Type
New Conventional
Estimated Equity
$288,824
Purchase Details
Closed on
Jul 21, 2003
Sold by
Bowie Lawrence D and Bowie Julie A
Bought by
Lamm Kenneth H and Lamm Barbara A
Home Financials for this Owner
Home Financials are based on the most recent Mortgage that was taken out on this home.
Original Mortgage
$209,600
Interest Rate
5.3%
Mortgage Type
Balloon
Create a Home Valuation Report for This Property
The Home Valuation Report is an in-depth analysis detailing your home's value as well as a comparison with similar homes in the area
Home Values in the Area
Average Home Value in this Area
Purchase History
| Date | Buyer | Sale Price | Title Company |
|---|---|---|---|
| Wyeth Robert K | $285,000 | None Available | |
| Lamm Kenneth H | $262,000 | Chicago Title Insurance Co |
Source: Public Records
Mortgage History
| Date | Status | Borrower | Loan Amount |
|---|---|---|---|
| Open | Wyeth Robert K | $256,500 | |
| Previous Owner | Lamm Kenneth H | $209,600 |
Source: Public Records
Tax History Compared to Growth
Tax History
| Year | Tax Paid | Tax Assessment Tax Assessment Total Assessment is a certain percentage of the fair market value that is determined by local assessors to be the total taxable value of land and additions on the property. | Land | Improvement |
|---|---|---|---|---|
| 2024 | $9,912 | $127,270 | $24,840 | $102,430 |
| 2023 | $9,912 | $115,910 | $22,620 | $93,290 |
| 2022 | $9,281 | $106,930 | $20,870 | $86,060 |
| 2021 | $9,047 | $104,830 | $20,460 | $84,370 |
| 2020 | $8,919 | $103,280 | $20,160 | $83,120 |
| 2019 | $8,622 | $101,160 | $19,750 | $81,410 |
| 2018 | $8,420 | $99,570 | $19,440 | $80,130 |
| 2017 | $8,201 | $96,760 | $18,890 | $77,870 |
| 2016 | $7,343 | $94,770 | $18,500 | $76,270 |
| 2015 | $7,390 | $93,090 | $18,170 | $74,920 |
| 2014 | $7,326 | $93,090 | $18,170 | $74,920 |
| 2013 | $7,261 | $93,090 | $18,170 | $74,920 |
Source: Public Records
Map
Nearby Homes
- 2711 Bayhill Dr
- 2806 Pine Valley Dr
- 2501 Woodridge Place
- 2005 Kenny Ave
- 2410 Cherry Hills Dr
- 3006 Countrybend Ln
- 2504 Jordan Dr
- 3104 Countrybend Ln
- 2401 Lakewood Dr
- 2512 Prairieridge Place
- 2801 Valleybrook Dr
- 2424 Prairie Ridge Place
- 2315 Clover Ln
- 2405 Prairieridge Place
- 2410 Wendover Place
- 2306 Winchester Dr
- 1609 Windward Point Unit 1609
- 2507 Windward Blvd
- 2903 Prairie Meadow Dr
- 1901 Branch Rd
- 2517 Pinehurst Dr
- 2519 Pinehurst Dr
- 2515 Pinehurst Dr
- 2518 Crystal Tree Dr
- 2520 Crystal Tree Dr
- 2521 Pinehurst Dr
- 2513 Pinehurst Dr
- 2516 Crystal Tree Dr
- 2514 Pinehurst Dr
- 2516 Pinehurst Dr
- 2512 Pinehurst Dr
- 2514 Crystal Tree Dr
- 2522 Crystal Tree Dr
- 2511 Pinehurst Dr
- 2518 Pinehurst Dr
- 2523 Pinehurst Dr
- 2510 Pinehurst Dr
- 2520 Pinehurst Dr
- 2512 Crystal Tree Dr
- 2508 Pinehurst Dr