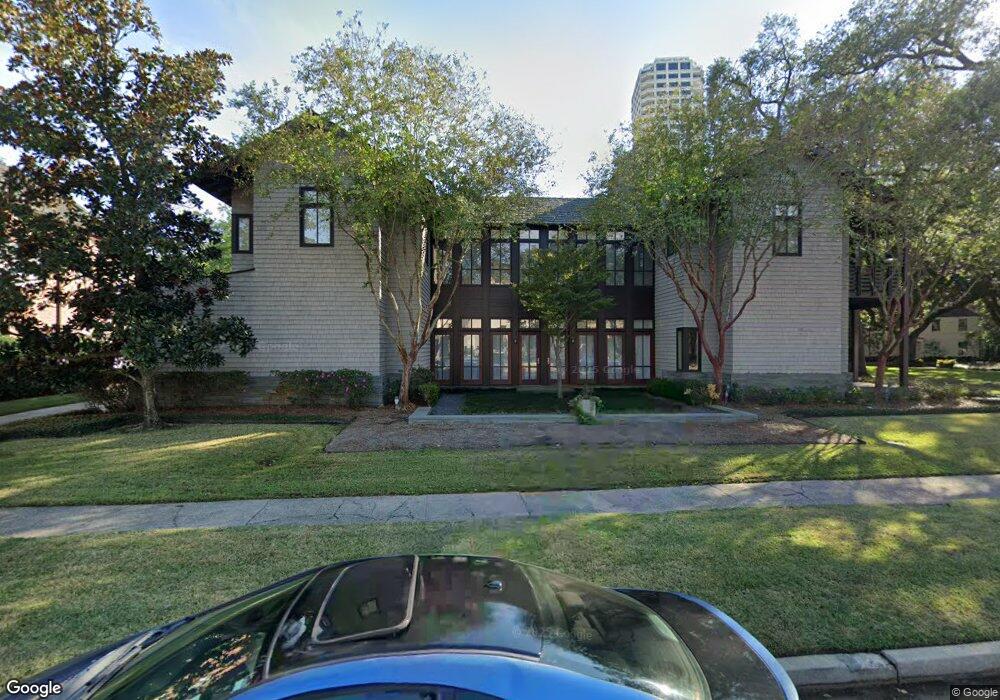
2517 Stanmore Dr Houston, TX 77019
River Oaks NeighborhoodEstimated Value: $3,306,332 - $4,098,000
3
Beds
5
Baths
5,455
Sq Ft
$658/Sq Ft
Est. Value
About This Home
This home is located at 2517 Stanmore Dr, Houston, TX 77019 and is currently estimated at $3,587,444, approximately $657 per square foot. 2517 Stanmore Dr is a home located in Harris County with nearby schools including River Oaks Elementary School, Lanier Middle School, and Lamar High School.
Ownership History
Date
Name
Owned For
Owner Type
Purchase Details
Closed on
May 21, 2018
Sold by
Shields Kathryn Kelly and Shields James Hamilton
Bought by
Judalon Llc
Current Estimated Value
Purchase Details
Closed on
Aug 1, 2012
Sold by
Abib Osmar and Abib Katherine
Bought by
Boss Willard J and Carruth Elizabeth Trent
Home Financials for this Owner
Home Financials are based on the most recent Mortgage that was taken out on this home.
Original Mortgage
$1,000,000
Interest Rate
3.75%
Mortgage Type
Adjustable Rate Mortgage/ARM
Purchase Details
Closed on
Jul 20, 2000
Sold by
Murray Ted S
Bought by
Abib Osmar and Abib Katherine
Home Financials for this Owner
Home Financials are based on the most recent Mortgage that was taken out on this home.
Original Mortgage
$600,000
Interest Rate
8.23%
Purchase Details
Closed on
Apr 4, 2000
Sold by
Villareal Fabian R
Bought by
Murray Ted S
Create a Home Valuation Report for This Property
The Home Valuation Report is an in-depth analysis detailing your home's value as well as a comparison with similar homes in the area
Home Values in the Area
Average Home Value in this Area
Purchase History
| Date | Buyer | Sale Price | Title Company |
|---|---|---|---|
| Judalon Llc | -- | Old Republic National Title | |
| Boss Willard J | -- | Old Republic National Title | |
| Abib Osmar | -- | American Title Co | |
| Murray Ted S | $600,000 | -- |
Source: Public Records
Mortgage History
| Date | Status | Borrower | Loan Amount |
|---|---|---|---|
| Previous Owner | Boss Willard J | $1,000,000 | |
| Previous Owner | Abib Osmar | $600,000 |
Source: Public Records
Tax History Compared to Growth
Tax History
| Year | Tax Paid | Tax Assessment Tax Assessment Total Assessment is a certain percentage of the fair market value that is determined by local assessors to be the total taxable value of land and additions on the property. | Land | Improvement |
|---|---|---|---|---|
| 2025 | $48,261 | $4,351,111 | $2,255,055 | $2,096,056 |
| 2024 | $48,261 | $3,363,708 | $2,118,385 | $1,245,323 |
| 2023 | $48,261 | $3,449,269 | $2,050,050 | $1,399,219 |
| 2022 | $78,621 | $3,664,644 | $1,981,715 | $1,682,929 |
| 2021 | $75,653 | $3,246,000 | $1,845,045 | $1,400,955 |
| 2020 | $82,519 | $3,422,174 | $1,845,045 | $1,577,129 |
| 2019 | $78,390 | $3,101,500 | $1,845,045 | $1,256,455 |
| 2018 | $56,991 | $2,816,234 | $1,776,710 | $1,039,524 |
| 2017 | $76,742 | $3,035,020 | $1,776,710 | $1,258,310 |
| 2016 | $70,168 | $2,775,000 | $1,516,690 | $1,258,310 |
| 2015 | $48,603 | $3,102,963 | $1,462,523 | $1,640,440 |
| 2014 | $48,603 | $2,986,155 | $1,245,853 | $1,740,302 |
Source: Public Records
Map
Nearby Homes
- 1915 Kirby Dr
- 2336 Welch St
- 1913 Revere St
- 2103 Argonne St Unit B
- 2323 San Felipe St Unit 901
- 2323 San Felipe St Unit 1101
- 2323 San Felipe St Unit 602
- 2419 Mimosa Dr Unit 601
- 2419 Mimosa Dr Unit 801
- 2419 Mimosa Dr Unit 603
- 2413 Mimosa Dr
- 2121 Kirby Dr Unit 12N
- 2240 Mimosa Dr Unit 4W
- 2240 Mimosa Dr Unit 4N
- 2240 Mimosa Dr Unit PH-8W
- 2240 Mimosa Dr Unit 6W
- 2240 Mimosa Dr Unit 5W
- 2240 Mimosa Dr Unit 3N
- 2240 Mimosa Dr Unit 6E
- 2240 Mimosa Dr Unit PH-7E
- 2445 Stanmore Dr
- 2521 Stanmore Dr
- 2443 Stanmore Dr
- 2514 Stanmore Dr
- 2441 Stanmore Dr
- 2523 Stanmore Dr
- 2524 Stanmore Dr
- 2529 Stanmore Dr
- 2508 Stanmore Dr
- 2525 Stanmore Dr
- 2504 Stanmore Dr
- 2439 Stanmore Dr
- 2438 Stanmore Dr
- 2521 Pelham Dr
- 2515 Pelham Dr
- 2413 San Felipe St
- 2509 Pelham Dr
- 2433 Stanmore Dr
- 2527 Pelham Dr
- 1903 Kirby Dr