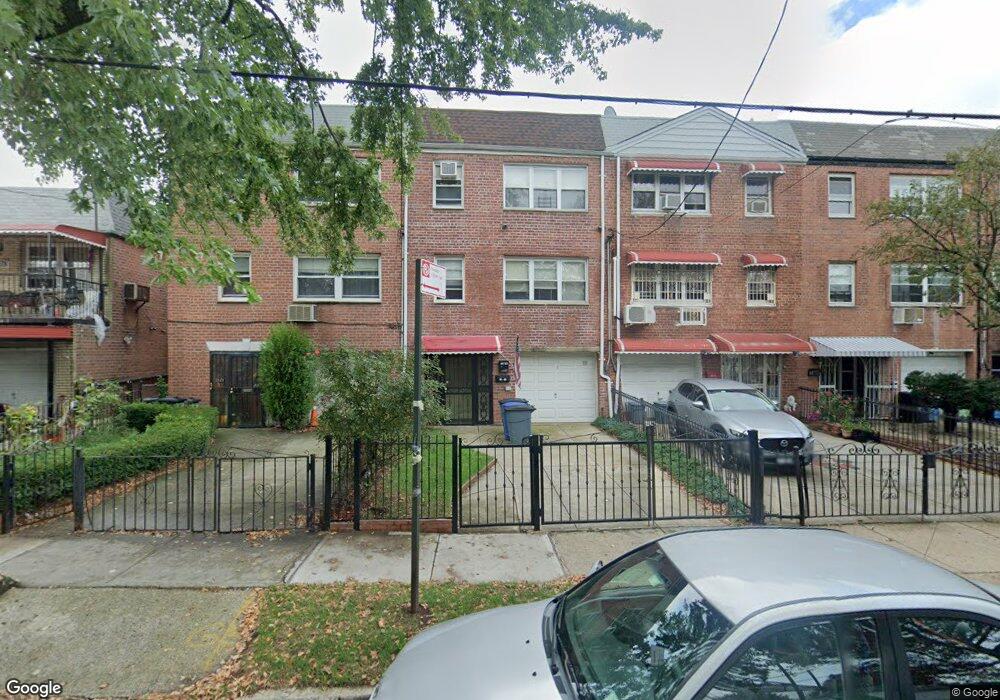
2518 78th St East Elmhurst, NY 11370
Jackson Heights NeighborhoodEstimated Value: $1,201,000 - $1,427,000
--
Bed
--
Bath
2,650
Sq Ft
$485/Sq Ft
Est. Value
About This Home
This home is located at 2518 78th St, East Elmhurst, NY 11370 and is currently estimated at $1,285,333, approximately $485 per square foot. 2518 78th St is a home located in Queens County with nearby schools including P.S. 2 Alfred Zimberg, Is 141 The Steinway, and William Cullen Bryant High School.
Ownership History
Date
Name
Owned For
Owner Type
Purchase Details
Closed on
Nov 26, 2024
Sold by
Pinto Virginia
Bought by
Pinto Virginia
Current Estimated Value
Purchase Details
Closed on
Apr 7, 2004
Sold by
Mcnaughton Mary
Bought by
Mcnaughton Life Eatate Mary and Pinto Virginia
Purchase Details
Closed on
Jan 9, 2004
Sold by
As Ancillary Administrat Of The Estate O and Pallette Katherine M
Bought by
Mcnaughton Mary
Create a Home Valuation Report for This Property
The Home Valuation Report is an in-depth analysis detailing your home's value as well as a comparison with similar homes in the area
Home Values in the Area
Average Home Value in this Area
Purchase History
| Date | Buyer | Sale Price | Title Company |
|---|---|---|---|
| Pinto Virginia | -- | -- | |
| Mcnaughton Life Eatate Mary | -- | -- | |
| Mcnaughton Life Eatate Mary | -- | -- | |
| Mcnaughton Mary | -- | -- | |
| Mcnaughton Mary | -- | -- |
Source: Public Records
Tax History Compared to Growth
Tax History
| Year | Tax Paid | Tax Assessment Tax Assessment Total Assessment is a certain percentage of the fair market value that is determined by local assessors to be the total taxable value of land and additions on the property. | Land | Improvement |
|---|---|---|---|---|
| 2025 | $10,864 | $58,822 | $8,429 | $50,393 |
| 2024 | $10,876 | $55,492 | $8,509 | $46,983 |
| 2023 | $10,234 | $52,352 | $7,725 | $44,627 |
| 2022 | $10,045 | $72,720 | $11,040 | $61,680 |
| 2021 | $10,596 | $69,060 | $11,040 | $58,020 |
| 2020 | $10,080 | $69,300 | $11,040 | $58,260 |
| 2019 | $9,381 | $69,780 | $11,040 | $58,740 |
| 2018 | $8,596 | $43,627 | $8,909 | $34,718 |
| 2017 | $8,492 | $43,130 | $8,927 | $34,203 |
| 2016 | $8,312 | $43,130 | $8,927 | $34,203 |
| 2015 | $4,688 | $40,848 | $11,887 | $28,961 |
| 2014 | $4,688 | $38,536 | $11,246 | $27,290 |
Source: Public Records
Map
Nearby Homes