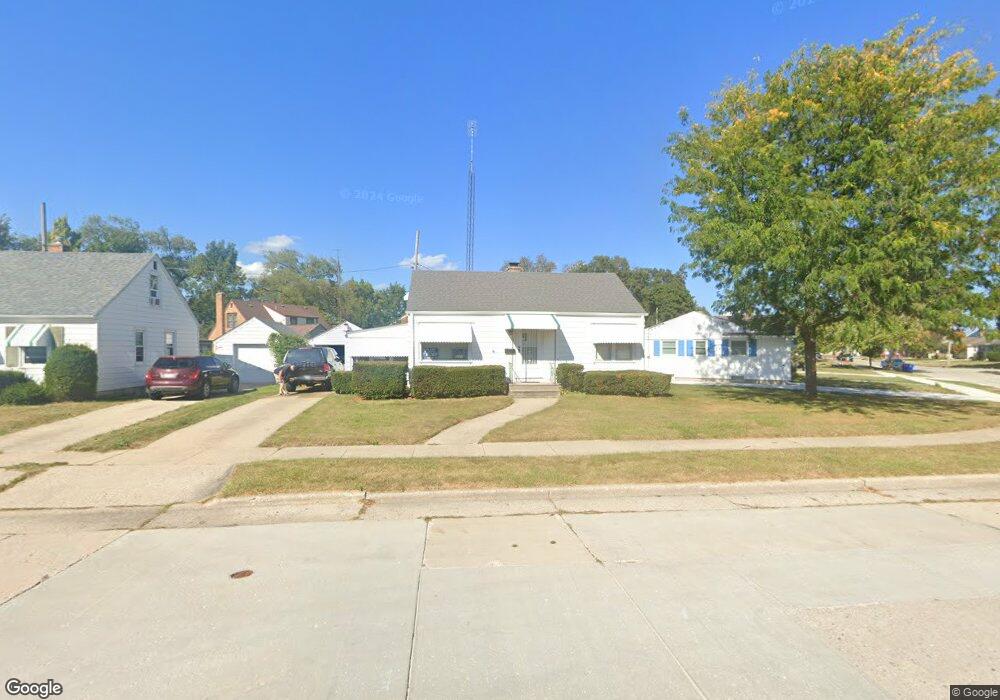
2518 79th St Kenosha, WI 53143
Sunnyside NeighborhoodEstimated Value: $227,121 - $244,000
3
Beds
1
Bath
988
Sq Ft
$239/Sq Ft
Est. Value
About This Home
This home is located at 2518 79th St, Kenosha, WI 53143 and is currently estimated at $235,780, approximately $238 per square foot. 2518 79th St is a home located in Kenosha County with nearby schools including Grewenow Elementary School, Lance Middle School, and Tremper High School.
Ownership History
Date
Name
Owned For
Owner Type
Purchase Details
Closed on
Jan 3, 2006
Sold by
Buratti Nello J
Bought by
Dickow Scott A
Current Estimated Value
Home Financials for this Owner
Home Financials are based on the most recent Mortgage that was taken out on this home.
Original Mortgage
$110,400
Outstanding Balance
$62,310
Interest Rate
6.34%
Mortgage Type
New Conventional
Estimated Equity
$173,470
Purchase Details
Closed on
Sep 2, 2005
Sold by
Bisciglia Mabel N
Bought by
Buratti Nello J
Create a Home Valuation Report for This Property
The Home Valuation Report is an in-depth analysis detailing your home's value as well as a comparison with similar homes in the area
Home Values in the Area
Average Home Value in this Area
Purchase History
| Date | Buyer | Sale Price | Title Company |
|---|---|---|---|
| Dickow Scott A | $138,000 | None Available | |
| Buratti Nello J | $100,000 | -- |
Source: Public Records
Mortgage History
| Date | Status | Borrower | Loan Amount |
|---|---|---|---|
| Open | Dickow Scott A | $110,400 |
Source: Public Records
Tax History Compared to Growth
Tax History
| Year | Tax Paid | Tax Assessment Tax Assessment Total Assessment is a certain percentage of the fair market value that is determined by local assessors to be the total taxable value of land and additions on the property. | Land | Improvement |
|---|---|---|---|---|
| 2024 | $2,795 | $122,000 | $32,500 | $89,500 |
| 2023 | $2,795 | $122,000 | $32,500 | $89,500 |
| 2022 | $2,836 | $122,000 | $32,500 | $89,500 |
| 2021 | $2,906 | $122,000 | $32,500 | $89,500 |
| 2020 | $3,015 | $122,000 | $32,500 | $89,500 |
| 2019 | $2,894 | $122,000 | $32,500 | $89,500 |
| 2018 | $2,847 | $112,900 | $32,500 | $80,400 |
| 2017 | $2,925 | $112,900 | $32,500 | $80,400 |
| 2016 | $2,857 | $112,900 | $32,500 | $80,400 |
| 2015 | $2,947 | $111,600 | $32,500 | $79,100 |
| 2014 | $2,924 | $111,600 | $32,500 | $79,100 |
Source: Public Records
Map
Nearby Homes