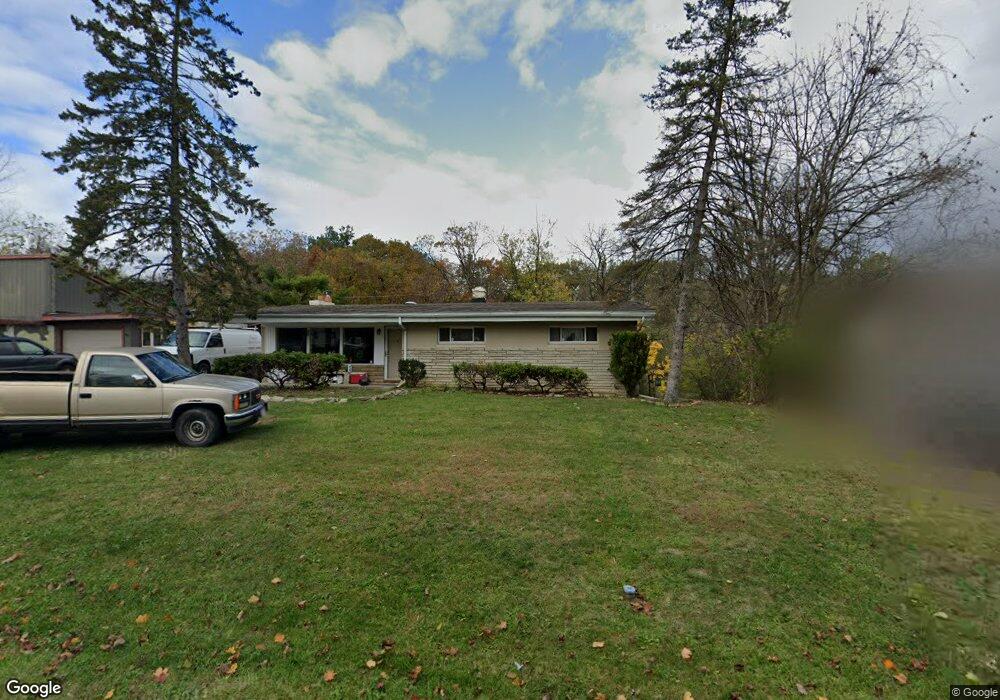
2518 Ferris Park Dr N Columbus, OH 43224
Hyde Park NeighborhoodEstimated Value: $181,750 - $202,000
3
Beds
1
Bath
1,132
Sq Ft
$169/Sq Ft
Est. Value
About This Home
This home is located at 2518 Ferris Park Dr N, Columbus, OH 43224 and is currently estimated at $191,188, approximately $168 per square foot. 2518 Ferris Park Dr N is a home located in Franklin County with nearby schools including Innis Elementary School, Mifflin Middle School, and Mifflin High School.
Ownership History
Date
Name
Owned For
Owner Type
Purchase Details
Closed on
Aug 22, 2001
Sold by
Smallwood Harry J and Smallwood Debra L
Bought by
Callicoat Clifford C
Current Estimated Value
Home Financials for this Owner
Home Financials are based on the most recent Mortgage that was taken out on this home.
Original Mortgage
$52,780
Outstanding Balance
$20,410
Interest Rate
7.03%
Mortgage Type
FHA
Estimated Equity
$170,778
Purchase Details
Closed on
Dec 14, 2000
Sold by
Hud
Bought by
Smallwood Harry J and Smallwood Debra L
Home Financials for this Owner
Home Financials are based on the most recent Mortgage that was taken out on this home.
Original Mortgage
$55,240
Interest Rate
8.62%
Purchase Details
Closed on
Jun 14, 2000
Sold by
Vanblarcume John E and Norwest Mtg Inc
Bought by
Hud
Purchase Details
Closed on
Oct 3, 1989
Bought by
Vanblarcume John E
Purchase Details
Closed on
Jul 8, 1988
Create a Home Valuation Report for This Property
The Home Valuation Report is an in-depth analysis detailing your home's value as well as a comparison with similar homes in the area
Home Values in the Area
Average Home Value in this Area
Purchase History
| Date | Buyer | Sale Price | Title Company |
|---|---|---|---|
| Callicoat Clifford C | $72,500 | -- | |
| Smallwood Harry J | $48,000 | Contract Processing & Title | |
| Hud | $50,000 | -- | |
| Vanblarcume John E | $56,000 | -- | |
| -- | -- | -- |
Source: Public Records
Mortgage History
| Date | Status | Borrower | Loan Amount |
|---|---|---|---|
| Open | Callicoat Clifford C | $52,780 | |
| Previous Owner | Smallwood Harry J | $55,240 |
Source: Public Records
Tax History Compared to Growth
Tax History
| Year | Tax Paid | Tax Assessment Tax Assessment Total Assessment is a certain percentage of the fair market value that is determined by local assessors to be the total taxable value of land and additions on the property. | Land | Improvement |
|---|---|---|---|---|
| 2024 | $2,961 | $47,010 | $11,970 | $35,040 |
| 2023 | $2,923 | $47,005 | $11,970 | $35,035 |
| 2022 | $3,029 | $35,670 | $8,650 | $27,020 |
| 2021 | $2,928 | $35,670 | $8,650 | $27,020 |
| 2020 | $2,848 | $35,670 | $8,650 | $27,020 |
| 2019 | $2,712 | $30,100 | $7,210 | $22,890 |
| 2018 | $2,145 | $30,100 | $7,210 | $22,890 |
| 2017 | $2,570 | $30,100 | $7,210 | $22,890 |
| 2016 | $1,693 | $17,850 | $3,500 | $14,350 |
| 2015 | $1,584 | $17,850 | $3,500 | $14,350 |
| 2014 | $1,586 | $17,850 | $3,500 | $14,350 |
| 2013 | $920 | $21,000 | $4,130 | $16,870 |
Source: Public Records
Map
Nearby Homes
- 4103 Arbury Ln
- 2529 Ferris Park Dr S
- 2547 Ferris Park Dr S
- 4090 Cleveland Ave
- 4161 Grayfriars Ln
- 3801 Westerville Rd
- 2283 Ward Rd
- 4211 Chesford Rd
- 2220 Sale Rd
- 2219 Sale Rd
- 2561 Adda Ave
- 3609 Westerville Rd Unit P-49
- 2594 Adda Ave
- 2588 Adda Ave
- 2144 Colfax Ave
- 2091 Radnor Ave
- 2023 Ferris Rd
- 2625 Clybourne Rd
- 2853 Stonecreek Ct Unit 2853
- 2551-2553 Woodsedge Rd
- 2528 Ferris Park Dr N
- 2508 Ferris Park Dr N
- 2513 Ferris Park Dr N
- 2523 Ferris Park Dr N
- 0 S Ferris Park Dr
- 2531 Ferris Park Dr N
- 2503 Ferris Park Dr N
- 2539 Ferris Park Dr N
- 2493 Ferris Park Dr N
- 2547 Ferris Park Dr N
- 2486 Ferris Park Dr N
- 2552 Ferris Park Dr N
- 2555 Ferris Park Dr N
- 2483 Ferris Park Dr N
- 2514 Ferris Park Dr S
- 2562 Ferris Park Dr N
- 2478 Ferris Park Dr N
- 2524 Ferris Park Dr S
- 2532 Ferris Park Dr S
- 2569 Ferris Park Dr N