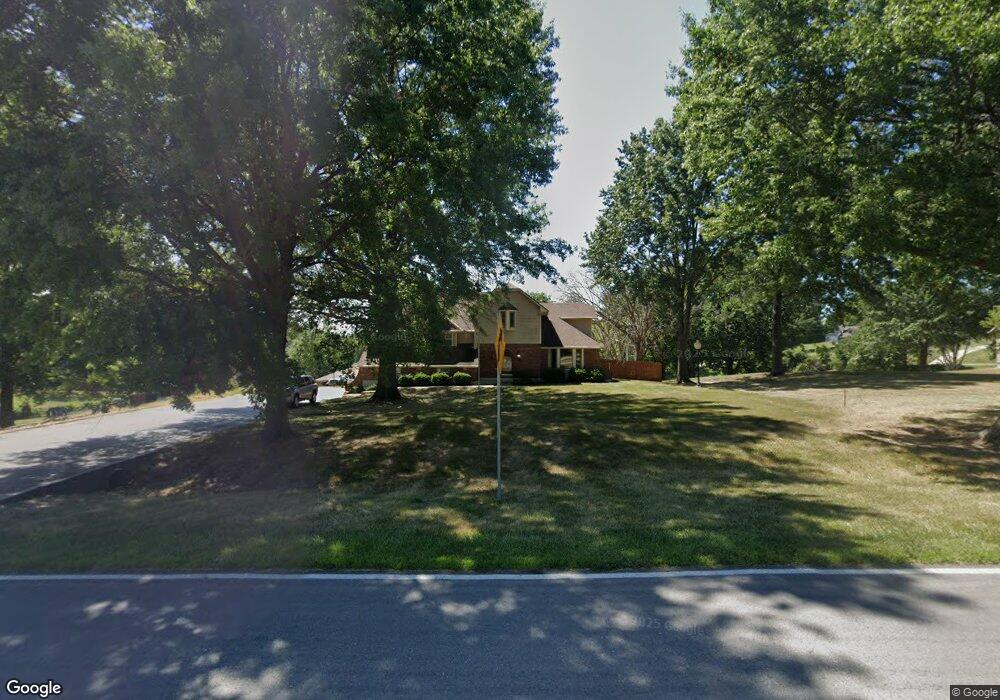
2518 N Twyman Rd Independence, MO 64058
Estimated Value: $441,948 - $593,000
4
Beds
4
Baths
2,744
Sq Ft
$193/Sq Ft
Est. Value
About This Home
This home is located at 2518 N Twyman Rd, Independence, MO 64058 and is currently estimated at $528,737, approximately $192 per square foot. 2518 N Twyman Rd is a home located in Jackson County with nearby schools including Fort Osage High School.
Ownership History
Date
Name
Owned For
Owner Type
Purchase Details
Closed on
Jan 17, 2020
Sold by
Weddle Sharon K and Weddle Kenneth B
Bought by
Kern Gretchen R and Grimes Jerry C
Current Estimated Value
Home Financials for this Owner
Home Financials are based on the most recent Mortgage that was taken out on this home.
Original Mortgage
$294,820
Outstanding Balance
$260,485
Interest Rate
3.6%
Mortgage Type
FHA
Estimated Equity
$268,252
Purchase Details
Closed on
Aug 25, 2010
Sold by
Weddle Sharon K
Bought by
Weddle Sharon K and Weddle Kenneth Brodley
Purchase Details
Closed on
Dec 5, 1996
Sold by
Fairfield Larry and Fairfield Carol
Bought by
Velder Sharon K
Home Financials for this Owner
Home Financials are based on the most recent Mortgage that was taken out on this home.
Original Mortgage
$143,000
Interest Rate
6.87%
Mortgage Type
Purchase Money Mortgage
Create a Home Valuation Report for This Property
The Home Valuation Report is an in-depth analysis detailing your home's value as well as a comparison with similar homes in the area
Home Values in the Area
Average Home Value in this Area
Purchase History
| Date | Buyer | Sale Price | Title Company |
|---|---|---|---|
| Kern Gretchen R | -- | None Available | |
| Weddle Sharon K | -- | None Available | |
| Velder Sharon K | -- | Stewart Title |
Source: Public Records
Mortgage History
| Date | Status | Borrower | Loan Amount |
|---|---|---|---|
| Open | Kern Gretchen R | $294,820 | |
| Previous Owner | Velder Sharon K | $143,000 |
Source: Public Records
Tax History Compared to Growth
Tax History
| Year | Tax Paid | Tax Assessment Tax Assessment Total Assessment is a certain percentage of the fair market value that is determined by local assessors to be the total taxable value of land and additions on the property. | Land | Improvement |
|---|---|---|---|---|
| 2025 | $6,762 | $63,823 | $6,424 | $57,399 |
| 2024 | $6,702 | $75,603 | $7,857 | $67,746 |
| 2023 | $6,702 | $75,603 | $6,494 | $69,109 |
| 2022 | $4,515 | $48,260 | $3,078 | $45,182 |
| 2021 | $4,520 | $48,260 | $3,078 | $45,182 |
| 2020 | $4,015 | $42,254 | $3,078 | $39,176 |
| 2019 | $3,934 | $42,254 | $3,078 | $39,176 |
| 2018 | $3,453 | $36,926 | $7,560 | $29,366 |
| 2017 | $3,453 | $36,926 | $7,560 | $29,366 |
| 2016 | $3,107 | $36,001 | $3,586 | $32,415 |
| 2014 | $3,122 | $36,001 | $3,586 | $32,415 |
Source: Public Records
Map
Nearby Homes
- 2801 N Lentz Rd
- 0 E Blue Mills Rd Unit 1992136
- 3410 N Perrin Rd
- 1622 N Charlton Rd
- 3724 N Perrin Rd
- 20912 E Us Highway 24
- 26612 E Blue Mills Rd
- 1515 N Elsea Smith Rd
- 1923 N Blue Mills Rd
- 701 N Bly Rd
- 1709 N Hanover Ave
- 20408 E 15th Terrace N
- 3901 N Koger Rd
- 27210 E Rogers Rd
- 27704 E Us Highway 24
- 20107 E Blue Mills Ct
- 20213 E 14th Terrace Ct N
- 19706 E 20th St N
- 512 N Bly Rd
- 22410 E Courtney Atherton Rd
- 2522 N Twyman Rd
- 2507 N Old Twyman Rd
- 23604 E Old Twyman Rd
- 2525 N Twyman Rd
- 2520 N Old Twyman Rd
- 2516 N Old Twyman Rd
- 2502 N Old Twyman Rd
- 2609 N Twyman Rd
- 2504 N Twyman Rd
- 2524 N Old Twyman Rd
- 2611 N Twyman Rd
- 23601 E Old Twyman Rd
- 2512 N Old Twyman Rd
- 2615 N Twyman Rd
- 23709 E Old Twyman Rd
- 2617 N Twyman Rd
- 2503 N Twyman Rd
- 2621 N Twyman Rd
- 2623 N Twyman Rd
- 2410 N Old Twyman Rd