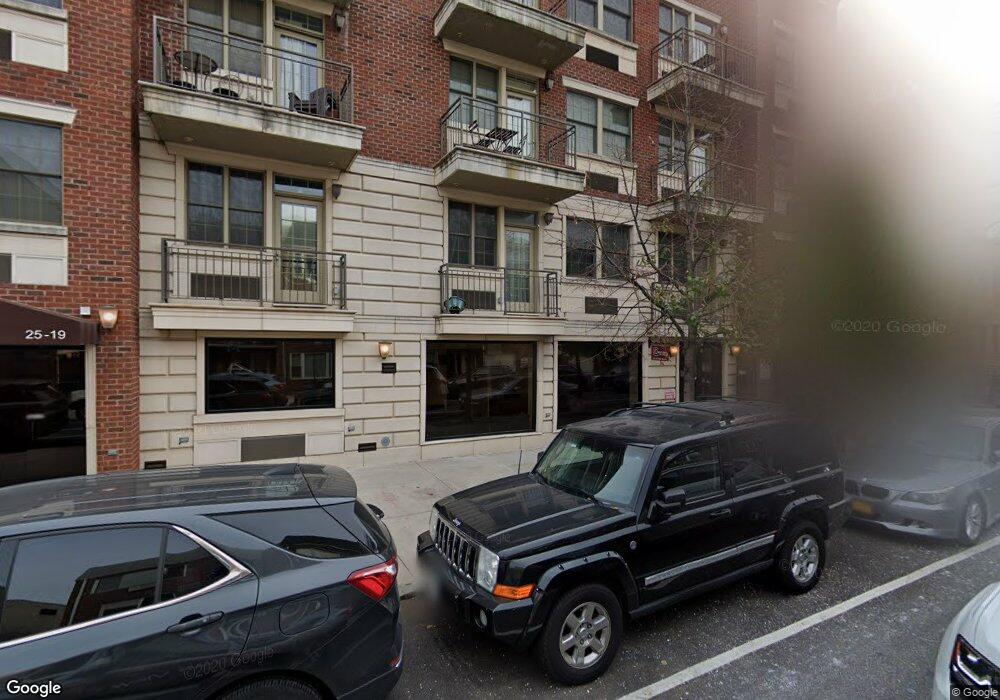
2519 35th St Unit 3D Astoria, NY 11103
Astoria NeighborhoodEstimated Value: $593,266 - $848,000
1
Bed
2
Baths
700
Sq Ft
$988/Sq Ft
Est. Value
About This Home
This home is located at 2519 35th St Unit 3D, Astoria, NY 11103 and is currently estimated at $691,567, approximately $987 per square foot. 2519 35th St Unit 3D is a home located in Queens County with nearby schools including I.S. 010 Horace Greeley, Long Island City High School, and St Joseph Catholic Academy.
Ownership History
Date
Name
Owned For
Owner Type
Purchase Details
Closed on
Mar 31, 2014
Sold by
Childers Andrew and Maeyer Bethany A
Bought by
Mock Andrea N and Wong Timothy
Current Estimated Value
Home Financials for this Owner
Home Financials are based on the most recent Mortgage that was taken out on this home.
Original Mortgage
$367,500
Outstanding Balance
$276,879
Interest Rate
4.26%
Mortgage Type
New Conventional
Estimated Equity
$414,688
Purchase Details
Closed on
Aug 23, 2010
Sold by
Wp Ventures 35Th St Llc
Bought by
Childers Andrew and Maeyer Bethany
Home Financials for this Owner
Home Financials are based on the most recent Mortgage that was taken out on this home.
Original Mortgage
$421,326
Interest Rate
4.75%
Mortgage Type
FHA
Create a Home Valuation Report for This Property
The Home Valuation Report is an in-depth analysis detailing your home's value as well as a comparison with similar homes in the area
Home Values in the Area
Average Home Value in this Area
Purchase History
| Date | Buyer | Sale Price | Title Company |
|---|---|---|---|
| Mock Andrea N | $490,000 | -- | |
| Mock Andrea N | $490,000 | -- | |
| Childers Andrew | $432,978 | -- | |
| Childers Andrew | $432,978 | -- |
Source: Public Records
Mortgage History
| Date | Status | Borrower | Loan Amount |
|---|---|---|---|
| Open | Mock Andrea N | $367,500 | |
| Closed | Mock Andrea N | $367,500 | |
| Previous Owner | Childers Andrew | $421,326 |
Source: Public Records
Tax History Compared to Growth
Tax History
| Year | Tax Paid | Tax Assessment Tax Assessment Total Assessment is a certain percentage of the fair market value that is determined by local assessors to be the total taxable value of land and additions on the property. | Land | Improvement |
|---|---|---|---|---|
| 2025 | $3,325 | $62,532 | $7,391 | $55,141 |
| 2024 | $3,325 | $62,983 | $7,391 | $55,592 |
| 2023 | $1,795 | $62,445 | $7,391 | $55,054 |
| 2022 | $285 | $60,774 | $7,391 | $53,383 |
| 2021 | $286 | $60,103 | $7,391 | $52,712 |
| 2020 | $291 | $68,141 | $7,391 | $60,750 |
| 2019 | $294 | $71,543 | $7,391 | $64,152 |
| 2018 | $7,095 | $59,299 | $7,391 | $51,908 |
| 2017 | $297 | $55,779 | $7,391 | $48,388 |
| 2016 | $301 | $55,779 | $7,391 | $48,388 |
| 2015 | $235 | $55,683 | $8,932 | $46,751 |
Source: Public Records
Map
Nearby Homes
- 25-54 37th St
- 24-75 38th St Unit A1
- 24-75 38th St Unit 5C
- 24-75 38th St Unit C9
- 24-75 38th St Unit A10
- 24-65 38 St Unit D10
- 24-75 38th St Unit D7/D8
- 24-65 38th St Unit D4
- 24-65 38th St Unit A5
- 2590 37th St
- 25-64 38th St
- 24-51 38th St Unit B7
- 2451 38th St Unit 7B
- 25-68 34th St
- 25-63 38th St Unit 1A
- 2569 38th St Unit 1R
- 25 W 28th St Unit PH 42 B
- 25 W 28th St Unit 41D
- 25 W 28th St Unit PH 43 A
- 25 W 28th St Unit PH 40 C
- 25-19 35th St Unit 1A
- 25-19 35th St Unit 4E
- 2519 35th St Unit 2D
- 2519 35th St Unit 1B
- 25-19 35th St Unit 2F
- 25-19 35th St Unit 4C
- 2519 35th St Unit 3E
- 2519 35th St Unit 2D
- 2519 35th St Unit 1A
- 2519 35th St Unit PH-2
- 2519 35th St Unit 4D
- 25-19 35th St Unit 4B
- 25-19 35th St
- 2519 35th St Unit 2B
- 2519 35th St Unit 4E
- 25-19 35th St Unit 3A
- 2519 35th St Unit 1B
- 2519 35th St Unit 3D
- 2519 35th St Unit 4B
- 2519 35th St Unit 2F