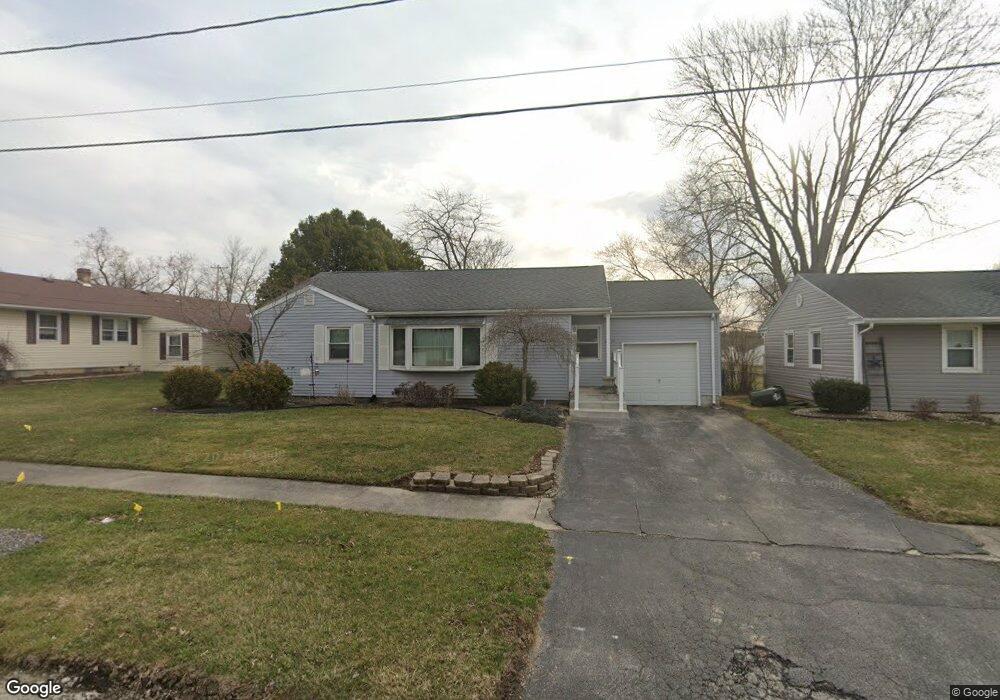
2519 Beecher St Findlay, OH 45840
Estimated Value: $184,066 - $192,000
3
Beds
1
Bath
1,172
Sq Ft
$161/Sq Ft
Est. Value
About This Home
This home is located at 2519 Beecher St, Findlay, OH 45840 and is currently estimated at $188,267, approximately $160 per square foot. 2519 Beecher St is a home located in Hancock County with nearby schools including Northview Elementary School, Bigelow Hill Elementary School, and Glenwood Middle School.
Ownership History
Date
Name
Owned For
Owner Type
Purchase Details
Closed on
Jun 3, 2002
Sold by
Hzllyer Joshua P
Bought by
Farrand Kelli A
Current Estimated Value
Home Financials for this Owner
Home Financials are based on the most recent Mortgage that was taken out on this home.
Original Mortgage
$80,000
Outstanding Balance
$32,939
Interest Rate
7%
Mortgage Type
New Conventional
Estimated Equity
$155,328
Purchase Details
Closed on
Nov 18, 1999
Sold by
Mittlehauser Andrea N
Bought by
Hillyer Joshua P and Hillyer Kathy J
Home Financials for this Owner
Home Financials are based on the most recent Mortgage that was taken out on this home.
Original Mortgage
$84,500
Interest Rate
7.88%
Mortgage Type
New Conventional
Purchase Details
Closed on
Nov 1, 1989
Bought by
Mittlehauser Andrea N
Purchase Details
Closed on
Jan 2, 1987
Bought by
Cecil David P and Cecil Rachel E
Purchase Details
Closed on
Jul 22, 1985
Bought by
Cook Ronald E and Cook Regina A
Purchase Details
Closed on
Apr 2, 1985
Bought by
Lonsway Russell J
Create a Home Valuation Report for This Property
The Home Valuation Report is an in-depth analysis detailing your home's value as well as a comparison with similar homes in the area
Home Values in the Area
Average Home Value in this Area
Purchase History
| Date | Buyer | Sale Price | Title Company |
|---|---|---|---|
| Farrand Kelli A | $103,500 | -- | |
| Hillyer Joshua P | $84,500 | -- | |
| Mittlehauser Andrea N | $52,000 | -- | |
| Cecil David P | $40,000 | -- | |
| Cook Ronald E | $30,000 | -- | |
| Lonsway Russell J | $17,500 | -- |
Source: Public Records
Mortgage History
| Date | Status | Borrower | Loan Amount |
|---|---|---|---|
| Open | Farrand Kelli A | $80,000 | |
| Previous Owner | Hillyer Joshua P | $84,500 |
Source: Public Records
Tax History
| Year | Tax Paid | Tax Assessment Tax Assessment Total Assessment is a certain percentage of the fair market value that is determined by local assessors to be the total taxable value of land and additions on the property. | Land | Improvement |
|---|---|---|---|---|
| 2024 | $1,693 | $47,660 | $6,020 | $41,640 |
| 2023 | $1,696 | $47,660 | $6,020 | $41,640 |
| 2022 | $1,697 | $47,660 | $6,020 | $41,640 |
| 2021 | $1,571 | $38,600 | $6,020 | $32,580 |
| 2020 | $1,571 | $38,600 | $6,020 | $32,580 |
| 2019 | $1,677 | $38,600 | $6,020 | $32,580 |
| 2018 | $1,569 | $33,560 | $5,230 | $28,330 |
| 2017 | $730 | $33,560 | $5,230 | $28,330 |
| 2016 | $1,445 | $33,560 | $5,230 | $28,330 |
| 2015 | $1,250 | $28,590 | $5,230 | $23,360 |
| 2014 | $1,250 | $28,590 | $5,230 | $23,360 |
| 2012 | $1,260 | $28,590 | $5,230 | $23,360 |
Source: Public Records
Map
Nearby Homes
- 2400 Hollybrook Dr
- 2419 Hollybrook Dr
- 245 Edinborough Dr
- 2604 N Main St
- 120 W Melrose Ave
- 400 Rosewood Ave
- 2318 Anna St
- 315 W Melrose Ave
- 2605 Eton Place
- 128 Harrington Ave
- 239 Edith Ave
- 323 W Bigelow Ave
- 241 Stanley Ave
- 217 Prentiss Ave
- 146 Clifton Ave
- 701 W Melrose Ave
- 528 Rector Ave
- 140 Monroe Ave
- 405 Clifton Ave
- 3105 Crosshill Dr
- 2515 Beecher St
- 227 Ellis Ave
- 231 Ellis Ave
- 2509 Beecher St
- 2444 Grace Blvd
- 2448 Grace Blvd
- 2505 Beecher St
- 2436 Grace Blvd
- 221 Ellis Ave
- 2522 Beecher St
- 2518 Beecher St
- 301 Ellis Ave
- 212 Ellis Ave
- 216 Ellis Ave
- 2514 Beecher St
- 2501 Beecher St
- 208 Ellis Ave
- 2432 Grace Blvd
- 221 Edinborough Dr
- 204 Ellis Ave
Your Personal Tour Guide
Ask me questions while you tour the home.