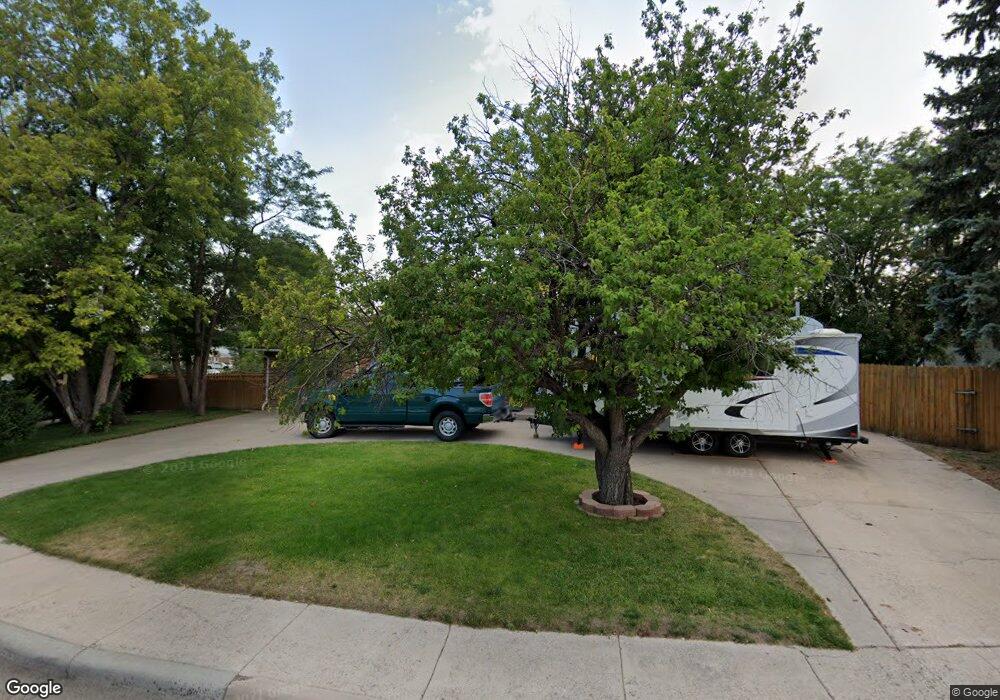
2519 Cactus Way Cheyenne, WY 82009
Estimated Value: $331,000 - $373,000
3
Beds
2
Baths
1,025
Sq Ft
$342/Sq Ft
Est. Value
About This Home
This home is located at 2519 Cactus Way, Cheyenne, WY 82009 and is currently estimated at $350,482, approximately $341 per square foot. 2519 Cactus Way is a home located in Laramie County with nearby schools including Buffalo Ridge Elementary School, Carey Junior High School, and East High School.
Ownership History
Date
Name
Owned For
Owner Type
Purchase Details
Closed on
Apr 30, 2008
Sold by
Zobel Timothy C and Zobel Kimberly A
Bought by
Salsgiver Troy A
Current Estimated Value
Home Financials for this Owner
Home Financials are based on the most recent Mortgage that was taken out on this home.
Original Mortgage
$136,705
Outstanding Balance
$86,393
Interest Rate
5.84%
Mortgage Type
Purchase Money Mortgage
Estimated Equity
$264,089
Purchase Details
Closed on
Dec 18, 2007
Sold by
Zobel Kimberly A and Zobel Timothy
Bought by
Zobel Timothy C and Zobel Kimberly A
Home Financials for this Owner
Home Financials are based on the most recent Mortgage that was taken out on this home.
Original Mortgage
$100,000
Interest Rate
6.26%
Mortgage Type
New Conventional
Purchase Details
Closed on
Sep 1, 2000
Sold by
Burris Shirey Lori A and Shirey Charles D
Bought by
Inman Kimberly A and Zobel Timothy
Purchase Details
Closed on
May 1, 2000
Sold by
Burris Lori A
Bought by
Shirey Charles D and Burris Shirey Lori A
Create a Home Valuation Report for This Property
The Home Valuation Report is an in-depth analysis detailing your home's value as well as a comparison with similar homes in the area
Home Values in the Area
Average Home Value in this Area
Purchase History
| Date | Buyer | Sale Price | Title Company |
|---|---|---|---|
| Salsgiver Troy A | -- | None Available | |
| Zobel Timothy C | -- | None Available | |
| Inman Kimberly A | -- | -- | |
| Shirey Charles D | -- | First American Title Ins Co |
Source: Public Records
Mortgage History
| Date | Status | Borrower | Loan Amount |
|---|---|---|---|
| Open | Salsgiver Troy A | $136,705 | |
| Previous Owner | Zobel Timothy C | $100,000 |
Source: Public Records
Tax History Compared to Growth
Tax History
| Year | Tax Paid | Tax Assessment Tax Assessment Total Assessment is a certain percentage of the fair market value that is determined by local assessors to be the total taxable value of land and additions on the property. | Land | Improvement |
|---|---|---|---|---|
| 2025 | $1,944 | $21,319 | $3,140 | $18,179 |
| 2024 | $1,944 | $27,489 | $4,187 | $23,302 |
| 2023 | $1,925 | $27,220 | $4,187 | $23,033 |
| 2022 | $1,818 | $25,186 | $4,187 | $20,999 |
| 2021 | $1,626 | $22,482 | $4,187 | $18,295 |
| 2020 | $1,471 | $20,397 | $4,187 | $16,210 |
| 2019 | $1,386 | $19,198 | $4,187 | $15,011 |
| 2018 | $1,311 | $18,336 | $3,145 | $15,191 |
| 2017 | $1,263 | $17,500 | $3,145 | $14,355 |
| 2016 | $1,202 | $16,650 | $2,983 | $13,667 |
| 2015 | $1,125 | $15,575 | $2,983 | $12,592 |
| 2014 | $1,116 | $15,350 | $2,983 | $12,367 |
Source: Public Records
Map
Nearby Homes
- 4745 Windmill Rd
- 4729 Cactus Way
- 5125 Maple Way
- 4940 Mountain Rd
- 4700 King Arthur Way
- 5245 Hickory Place
- 2507 Pattison Ave Unit 1-4
- 100 Clover Ct
- 5402 Hilltop Ave
- 3117 Douglas St
- 5120 Bowie Dr
- 5502 Canyon Rd
- 3315 Dean Paul Dr
- 4816 Ridge Rd
- 2113 Pattison Ave
- 5208 Danielle Ct
- 5702 Mica Bluff
- 2544 Levi Rd
- 5801 Mica Bluff
- 4744 Piccadilly Dr
- 4764 Cactus Way
- 4775 Windmill Rd
- 4769 Windmill Rd
- 4758 Cactus Way
- 4763 Windmill Rd
- 4777 Cactus Way
- 2514 Cactus Way
- 2520 Cactus Way
- 4771 Cactus Way
- 2508 Cactus Way
- 4765 Cactus Way
- 5005 Windmill Rd
- 4757 Windmill Rd
- 4752 Cactus Way
- 4759 Cactus Way
- 2519 Jackson Ct
- 4776 Linden Way
- 5013 Windmill Rd
- 4772 Windmill Rd
- 4770 Linden Way