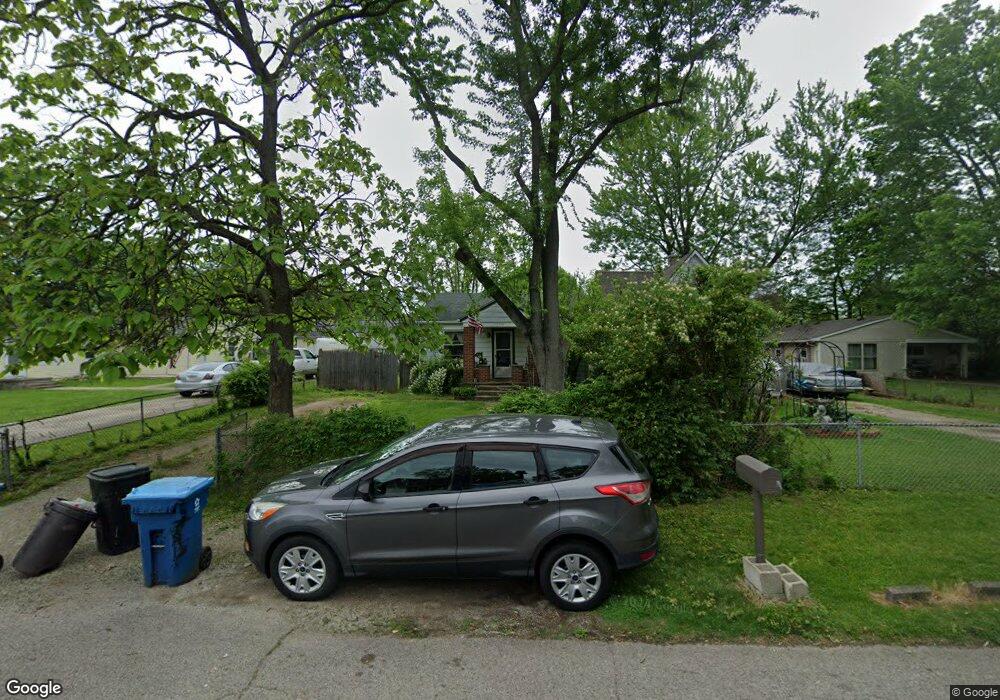
2519 Guernsey Dell Ave Dayton, OH 45404
Avondale NeighborhoodEstimated Value: $97,000 - $124,000
3
Beds
1
Bath
960
Sq Ft
$111/Sq Ft
Est. Value
About This Home
This home is located at 2519 Guernsey Dell Ave, Dayton, OH 45404 and is currently estimated at $106,136, approximately $110 per square foot. 2519 Guernsey Dell Ave is a home located in Montgomery County with nearby schools including Stebbins High School, Pathway School of Discovery, and Horizon Science Academy Dayton Downtown.
Ownership History
Date
Name
Owned For
Owner Type
Purchase Details
Closed on
Mar 26, 2012
Sold by
Holloway Timothy E
Bought by
Holloway Marie A
Current Estimated Value
Purchase Details
Closed on
Apr 29, 2002
Sold by
Halloway Marie A and Holloway Marie A
Bought by
Holloway Timothy and Holloway Marie A
Home Financials for this Owner
Home Financials are based on the most recent Mortgage that was taken out on this home.
Original Mortgage
$35,000
Outstanding Balance
$14,842
Interest Rate
6.99%
Estimated Equity
$91,294
Purchase Details
Closed on
Mar 8, 2002
Sold by
Estate Of Jolan E Chavis
Bought by
Halloway Marie A
Home Financials for this Owner
Home Financials are based on the most recent Mortgage that was taken out on this home.
Original Mortgage
$35,000
Outstanding Balance
$14,842
Interest Rate
6.99%
Estimated Equity
$91,294
Create a Home Valuation Report for This Property
The Home Valuation Report is an in-depth analysis detailing your home's value as well as a comparison with similar homes in the area
Home Values in the Area
Average Home Value in this Area
Purchase History
| Date | Buyer | Sale Price | Title Company |
|---|---|---|---|
| Holloway Marie A | -- | None Available | |
| Holloway Timothy | -- | -- | |
| Halloway Marie A | -- | -- |
Source: Public Records
Mortgage History
| Date | Status | Borrower | Loan Amount |
|---|---|---|---|
| Open | Holloway Timothy | $35,000 |
Source: Public Records
Tax History Compared to Growth
Tax History
| Year | Tax Paid | Tax Assessment Tax Assessment Total Assessment is a certain percentage of the fair market value that is determined by local assessors to be the total taxable value of land and additions on the property. | Land | Improvement |
|---|---|---|---|---|
| 2024 | $1,019 | $20,340 | $4,240 | $16,100 |
| 2023 | $1,019 | $20,340 | $4,240 | $16,100 |
| 2022 | $1,087 | $16,270 | $3,390 | $12,880 |
| 2021 | $1,107 | $16,270 | $3,390 | $12,880 |
| 2020 | $1,107 | $16,270 | $3,390 | $12,880 |
| 2019 | $1,160 | $15,250 | $3,050 | $12,200 |
| 2018 | $1,163 | $15,250 | $3,050 | $12,200 |
| 2017 | $1,163 | $15,250 | $3,050 | $12,200 |
| 2016 | $1,163 | $14,800 | $3,390 | $11,410 |
| 2015 | $1,301 | $14,800 | $3,390 | $11,410 |
| 2014 | $1,301 | $14,800 | $3,390 | $11,410 |
| 2012 | -- | $14,720 | $3,400 | $11,320 |
Source: Public Records
Map
Nearby Homes
- 2460 Bushnell Ave
- 546 Wynora Ave
- -- Valley Pike
- - Valley Pike
- 2249 - Valley Pike
- 2301 Valley Pike
- 518 Tyron Ave
- - Prince Albert Blvd
- -- Prince Albert Blvd
- 641 Prince Albert Blvd
- 2249 Prince Albert Blvd
- 3586 Lane Garden Ct
- 2249 Valley Pike
- 2245 Valley Pike
- 1930 Brandt Pike
- - Rondowa Ave
- -- Rondowa Ave
- 241 Community Dr
- 620 Homecrest Ave
- 3535 Golden Meadows Ct
- 2521 Guernsey Dell Ave
- 2523 Guernsey Dell Ave
- 2515 Guernsey Dell Ave
- 2543 Guernsey Dell Ave
- 2507 Guernsey Dell Ave
- 2518 Forest Home Ave
- 2516 Forest Home Ave
- 2528 Forest Home Ave
- 2514 Forest Home Ave
- 2530 Forest Home Ave
- 2516 Guernsey Dell Ave
- 2518 Guernsey Dell Ave
- 2510 Guernsey Dell Ave
- 2536 Forest Home Ave
- 2532 Guernsey Dell Ave
- 2504 Forest Home Ave
- 2542 Forest Home Ave
- 2549 Guernsey Dell Ave
- 2508 Guernsey Dell Ave
- 2501 Guernsey Dell Ave