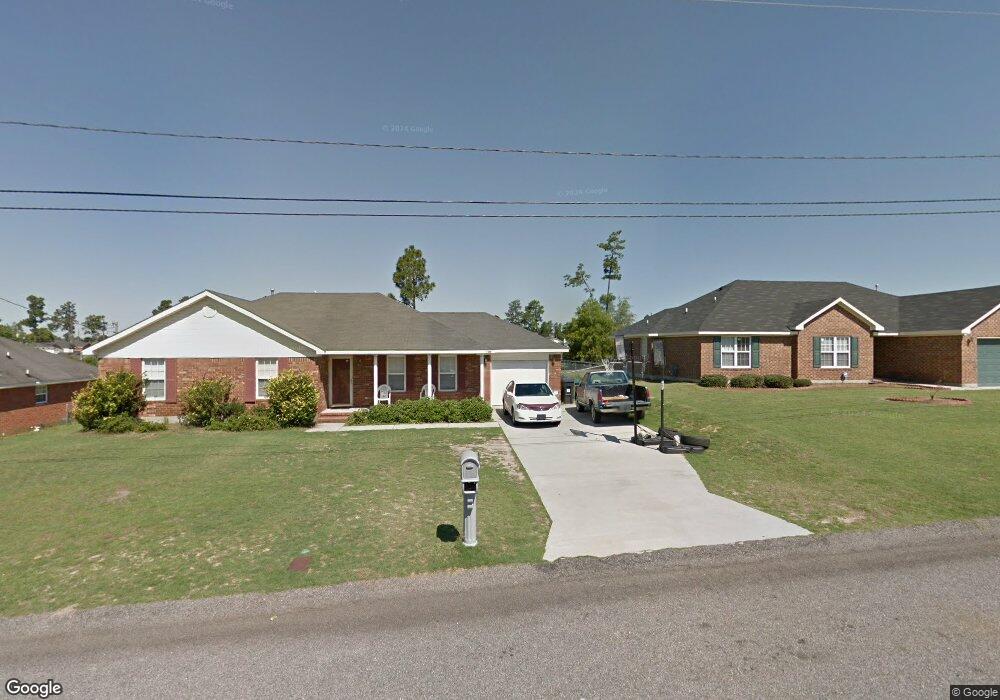
2519 Smoketree Rd Augusta, GA 30906
Pepperidge NeighborhoodEstimated Value: $187,000 - $230,000
3
Beds
2
Baths
1,550
Sq Ft
$132/Sq Ft
Est. Value
About This Home
This home is located at 2519 Smoketree Rd, Augusta, GA 30906 and is currently estimated at $204,265, approximately $131 per square foot. 2519 Smoketree Rd is a home located in Richmond County with nearby schools including Tobacco Road Elementary School, Richmond Hill K-8, and Johnson Magnet.
Ownership History
Date
Name
Owned For
Owner Type
Purchase Details
Closed on
Oct 11, 2007
Sold by
Williams Jerry L
Bought by
Strategic Developments Llc Series I
Current Estimated Value
Purchase Details
Closed on
May 21, 2007
Sold by
Sec Of Hud
Bought by
Strategic Development Inc
Home Financials for this Owner
Home Financials are based on the most recent Mortgage that was taken out on this home.
Original Mortgage
$77,200
Interest Rate
6.12%
Mortgage Type
Purchase Money Mortgage
Purchase Details
Closed on
May 17, 2007
Sold by
Hud
Bought by
Strategic Development Inc
Home Financials for this Owner
Home Financials are based on the most recent Mortgage that was taken out on this home.
Original Mortgage
$77,200
Interest Rate
6.12%
Mortgage Type
Purchase Money Mortgage
Purchase Details
Closed on
Aug 1, 2006
Sold by
Gmac Mortgage Corp
Bought by
Hud
Purchase Details
Closed on
Jul 13, 2001
Sold by
C & R Home Builders Inc
Bought by
Royal Roosevelt
Home Financials for this Owner
Home Financials are based on the most recent Mortgage that was taken out on this home.
Original Mortgage
$94,418
Interest Rate
7.08%
Mortgage Type
FHA
Purchase Details
Closed on
May 17, 1999
Sold by
Pepperidge Pointe Inc
Bought by
C & R Home Builders Inc
Home Financials for this Owner
Home Financials are based on the most recent Mortgage that was taken out on this home.
Original Mortgage
$84,000
Interest Rate
6.87%
Purchase Details
Closed on
Sep 2, 1998
Sold by
Pepperidge Pointe Inc
Bought by
Pepperidge Pointe Inc
Purchase Details
Closed on
Sep 22, 1995
Sold by
Miller Larry D Dixon Don O'Neal James O
Bought by
Pepperidge Pointe Inc
Create a Home Valuation Report for This Property
The Home Valuation Report is an in-depth analysis detailing your home's value as well as a comparison with similar homes in the area
Home Values in the Area
Average Home Value in this Area
Purchase History
| Date | Buyer | Sale Price | Title Company |
|---|---|---|---|
| Strategic Developments Llc Series I | -- | None Available | |
| Strategic Developments Llc | -- | -- | |
| Strategic Development Inc | $96,500 | -- | |
| Strategic Development Inc | -- | None Available | |
| Hud | -- | None Available | |
| Gmac Mortgage Corp | $108,822 | None Available | |
| Gmac Mortgage Corporaton | $108,800 | -- | |
| Royal Roosevelt | $95,900 | -- | |
| Royal Roosevelt | -- | -- | |
| C & R Home Builders Inc | $13,900 | -- | |
| C&R Home Builders I | $13,900 | -- | |
| Pepperidge Pointe Inc | -- | -- | |
| Pepperidge Pointe Inc | -- | -- |
Source: Public Records
Mortgage History
| Date | Status | Borrower | Loan Amount |
|---|---|---|---|
| Previous Owner | Strategic Development Inc | $77,200 | |
| Previous Owner | Strategic Development Inc | $77,200 | |
| Previous Owner | Royal Roosevelt | $94,418 | |
| Previous Owner | C&R Home Builders I | $84,000 |
Source: Public Records
Tax History
| Year | Tax Paid | Tax Assessment Tax Assessment Total Assessment is a certain percentage of the fair market value that is determined by local assessors to be the total taxable value of land and additions on the property. | Land | Improvement |
|---|---|---|---|---|
| 2025 | $2,469 | $74,380 | $7,380 | $67,000 |
| 2024 | $2,469 | $71,424 | $7,380 | $64,044 |
| 2023 | $2,313 | $68,824 | $7,380 | $61,444 |
| 2022 | $2,034 | $58,501 | $7,380 | $51,121 |
| 2021 | $1,647 | $40,707 | $7,380 | $33,327 |
| 2020 | $1,623 | $40,707 | $7,380 | $33,327 |
| 2019 | $1,713 | $40,707 | $7,380 | $33,327 |
| 2018 | $1,724 | $40,707 | $7,380 | $33,327 |
| 2017 | $1,665 | $40,707 | $7,380 | $33,327 |
| 2016 | $1,666 | $40,707 | $7,380 | $33,327 |
| 2015 | $1,677 | $40,707 | $7,380 | $33,327 |
| 2014 | $1,678 | $40,707 | $7,380 | $33,327 |
Source: Public Records
Map
Nearby Homes
- 4349 White Pines Ct
- 3388 Thames Place
- 3758 Bansbury Place
- 3434 Thames Place
- 3436 Thames Place
- 2120 Faircrest Ave
- 3346 Thames Place
- 3545 Monte Carlo Dr
- 3622 Seelye Dr
- 4104 Short Leaf Ct
- 2104 Oakleaf Way
- 3414 Essex Place
- 3411 Essex Place
- 3640 Elliott Blvd
- 3708 Lexington Dr
- 2113 Chadwick Rd
- 3611 Kentwood Dr Unit 1
- 2115 Ashley Dr
- 3606 Greiner Dr
- 2219 Travis Rd
- 2521 Smoketree Rd
- 2517 Smoketree Rd
- 0 Smoketree Rd
- 3337 Hamden St
- 3335 Hamden St
- 2515 Smoketree Rd
- 2523 Smoketree Rd
- 3339 Hamden St
- 3333 Hamden St
- 2516 Smoketree Rd
- 2514 Smoketree Rd
- 2518 Smoketree Rd
- 3341 Hamden St
- 3331 Hamden St
- 2513 Smoketree Rd
- 2512 Smoketree Rd
- 2520 Smoketree Rd
- 3343 Hamden St
- 3329 Hamden St
- 2522 Smoketree Rd
Your Personal Tour Guide
Ask me questions while you tour the home.