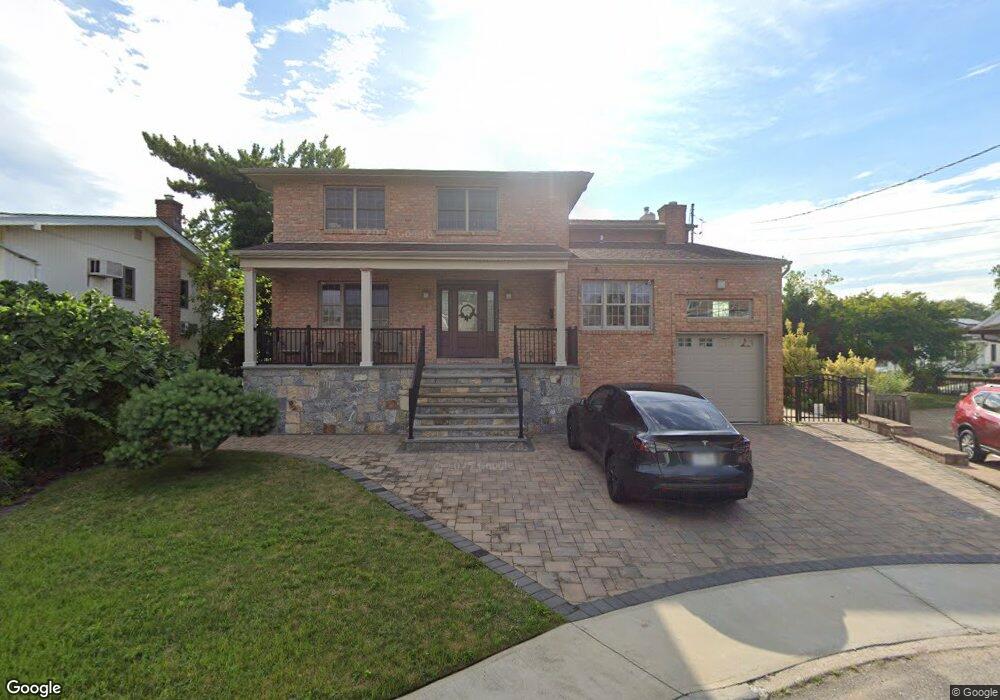
2519 Soma Ave Bellmore, NY 11710
Estimated Value: $1,095,113 - $1,208,000
--
Bed
4
Baths
2,736
Sq Ft
$421/Sq Ft
Est. Value
About This Home
This home is located at 2519 Soma Ave, Bellmore, NY 11710 and is currently estimated at $1,151,557, approximately $420 per square foot. 2519 Soma Ave is a home located in Nassau County with nearby schools including Lt. General Thomas P. Stafford Elementary School, Winthrop Avenue School, and Shore Road School.
Ownership History
Date
Name
Owned For
Owner Type
Purchase Details
Closed on
Jul 23, 2025
Sold by
Marcus Gary and Chin Melanie
Bought by
Chin Melanie
Current Estimated Value
Home Financials for this Owner
Home Financials are based on the most recent Mortgage that was taken out on this home.
Original Mortgage
$700,000
Outstanding Balance
$698,203
Interest Rate
6.81%
Mortgage Type
New Conventional
Estimated Equity
$453,354
Purchase Details
Closed on
Nov 4, 2010
Sold by
Kraut Tsvika
Bought by
Marcus Gary
Purchase Details
Closed on
Mar 6, 2009
Sold by
Kraut Tsvika
Bought by
Kraut Tsvika and Kraut Cheryl
Purchase Details
Closed on
Sep 15, 2004
Sold by
Zwelsky Joan
Bought by
Kraut Tsvika
Create a Home Valuation Report for This Property
The Home Valuation Report is an in-depth analysis detailing your home's value as well as a comparison with similar homes in the area
Home Values in the Area
Average Home Value in this Area
Purchase History
| Date | Buyer | Sale Price | Title Company |
|---|---|---|---|
| Chin Melanie | -- | Nts | |
| Marcus Gary | $600,000 | -- | |
| Marcus Gary | $600,000 | -- | |
| Marcus Gary | $600,000 | -- | |
| Kraut Tsvika | -- | Standard Form Of New York | |
| Kraut Tsvika | -- | Standard Form Of New York | |
| Kraut Tsvika | -- | Standard Form Of New York | |
| Kraut Tsvika | $580,000 | -- | |
| Kraut Tsvika | $580,000 | -- |
Source: Public Records
Mortgage History
| Date | Status | Borrower | Loan Amount |
|---|---|---|---|
| Open | Chin Melanie | $700,000 |
Source: Public Records
Tax History Compared to Growth
Tax History
| Year | Tax Paid | Tax Assessment Tax Assessment Total Assessment is a certain percentage of the fair market value that is determined by local assessors to be the total taxable value of land and additions on the property. | Land | Improvement |
|---|---|---|---|---|
| 2025 | $20,499 | $721 | $203 | $518 |
| 2024 | $5,873 | $822 | $231 | $591 |
| 2023 | $21,489 | $854 | $244 | $610 |
| 2022 | $21,489 | $854 | $244 | $610 |
| 2021 | $27,450 | $818 | $234 | $584 |
| 2020 | $11,979 | $954 | $639 | $315 |
| 2019 | $16,064 | $1,022 | $684 | $338 |
| 2018 | $16,213 | $1,140 | $0 | $0 |
| 2017 | $11,048 | $1,140 | $763 | $377 |
| 2016 | $16,042 | $1,140 | $725 | $415 |
| 2015 | $4,649 | $1,140 | $659 | $481 |
| 2014 | $4,649 | $1,140 | $659 | $481 |
| 2013 | $4,595 | $1,200 | $694 | $506 |
Source: Public Records
Map
Nearby Homes
- 23 Bay St
- 119 Ocean Ave
- 2492 Lefferts Place
- 2770 Lincoln Blvd
- 2542 Lefferts Place
- 14 Bell Ct
- 1360-1370 Merrick Rd
- 2476 Florin Ct
- 163 Wynsum Ave
- 601 Hughes St
- 217 Bayview Ave
- 110 Hampton Way
- 2810 Wynsum Ave
- 2490 Orange St
- 2573 Legion St
- 2523 Horace Ct
- 45 Henry St
- 732 Sunrise Ave
- 2545 Horace Ct
- 2072 Brighton Way