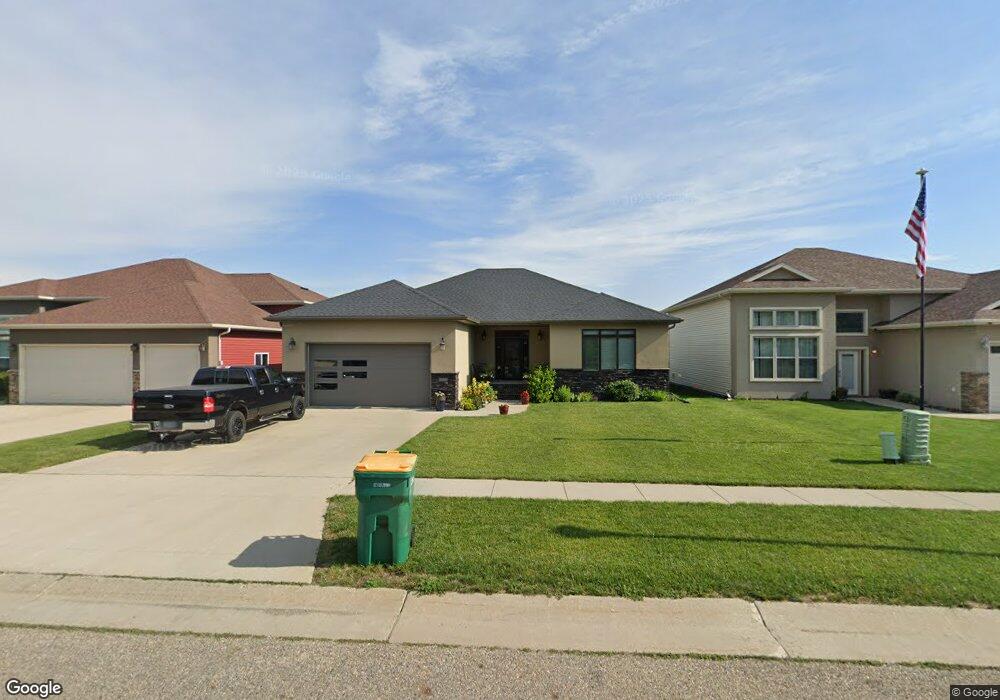
252 34th Ave E West Fargo, ND 58078
Shadow Wood-Shadow Creek NeighborhoodEstimated Value: $485,786 - $532,000
5
Beds
3
Baths
3,570
Sq Ft
$143/Sq Ft
Est. Value
About This Home
This home is located at 252 34th Ave E, West Fargo, ND 58078 and is currently estimated at $508,893, approximately $142 per square foot. 252 34th Ave E is a home located in Cass County with nearby schools including Aurora Elementary School, Liberty Middle School, and West Fargo Sheyenne High School.
Ownership History
Date
Name
Owned For
Owner Type
Purchase Details
Closed on
Nov 29, 2019
Sold by
Elrashidy Ramy E and Elrashidy Shelby M
Bought by
Jelsing Nodean and Jelsing Deanna
Current Estimated Value
Purchase Details
Closed on
Jul 14, 2017
Sold by
Hase Amy M
Bought by
Elrashidy Ramy E and Durland Shelby M
Home Financials for this Owner
Home Financials are based on the most recent Mortgage that was taken out on this home.
Original Mortgage
$313,500
Interest Rate
3.94%
Mortgage Type
New Conventional
Purchase Details
Closed on
May 11, 2015
Sold by
Builders Drywall Inc
Bought by
Hase Amy M
Home Financials for this Owner
Home Financials are based on the most recent Mortgage that was taken out on this home.
Original Mortgage
$293,400
Interest Rate
3.68%
Mortgage Type
New Conventional
Purchase Details
Closed on
Sep 6, 2013
Sold by
Prairie Heights Community Church Of The
Bought by
Builders Drywall Inc
Create a Home Valuation Report for This Property
The Home Valuation Report is an in-depth analysis detailing your home's value as well as a comparison with similar homes in the area
Home Values in the Area
Average Home Value in this Area
Purchase History
| Date | Buyer | Sale Price | Title Company |
|---|---|---|---|
| Jelsing Nodean | $335,000 | Title Co | |
| Elrashidy Ramy E | $330,000 | Regency Title Inc | |
| Hase Amy M | -- | None Available | |
| Builders Drywall Inc | $22,000 | Title Co |
Source: Public Records
Mortgage History
| Date | Status | Borrower | Loan Amount |
|---|---|---|---|
| Previous Owner | Elrashidy Ramy E | $313,500 | |
| Previous Owner | Hase Amy M | $293,400 |
Source: Public Records
Tax History
| Year | Tax Paid | Tax Assessment Tax Assessment Total Assessment is a certain percentage of the fair market value that is determined by local assessors to be the total taxable value of land and additions on the property. | Land | Improvement |
|---|---|---|---|---|
| 2024 | $7,960 | $235,550 | $33,000 | $202,550 |
| 2023 | $8,342 | $223,500 | $33,000 | $190,500 |
| 2022 | $8,230 | $205,800 | $33,000 | $172,800 |
| 2021 | $8,002 | $192,500 | $27,000 | $165,500 |
| 2020 | $7,909 | $192,000 | $27,000 | $165,000 |
| 2019 | $7,998 | $191,700 | $27,000 | $164,700 |
| 2018 | $7,841 | $189,250 | $27,000 | $162,250 |
| 2017 | $5,846 | $115,900 | $27,000 | $88,900 |
| 2016 | $5,425 | $111,650 | $27,000 | $84,650 |
| 2015 | $7,153 | $171,350 | $17,450 | $153,900 |
| 2014 | $3,809 | $35,200 | $17,450 | $17,750 |
| 2013 | $3,214 | $12,250 | $12,250 | $0 |
Source: Public Records
Map
Nearby Homes
- 246 34th Ave E
- 267 34th Ave E
- 3371 1st St
- 433 Foxtail Dr
- 503 33rd Way E Unit B
- 3028 Ridge Dr E
- 445 E Foxtail Dr
- 3605 Houkom Dr E
- 3037 Claire Dr E
- 501 Foxtail Dr
- 229 36 1 2 Avenue Place E
- 3463 Loberg Dr
- 717 35th Ave E
- 3702 Houkom Dr E
- 2858 Rivers Bend Dr E
- 3137 6th St E
- 2836 River's Bend Dr E
- 3644 6th St E
- 3755 Houkom Dr E
- 360 32nd Ave W Unit 701
- 258 34th Ave E
- 240 34th Ave E
- 264 34th Ave E
- 234 34th Ave E
- 249 34th Ave E
- 270 34th Ave E
- 255 34th Ave E
- 243 34th Ave E
- 261 34th Ave E
- 228 34th Ave E
- 237 34th Ave E
- 276 34th Ave E
- 231 34th Ave E
- 273 34th Ave E
- 222 34th Ave E
- 225 34th Ave E
- 3426 Shadow Wood Ln
- 3418 Shadow Wood Ln
- 3434 Shadow Wood Ln
- 216 34th Ave E
Your Personal Tour Guide
Ask me questions while you tour the home.