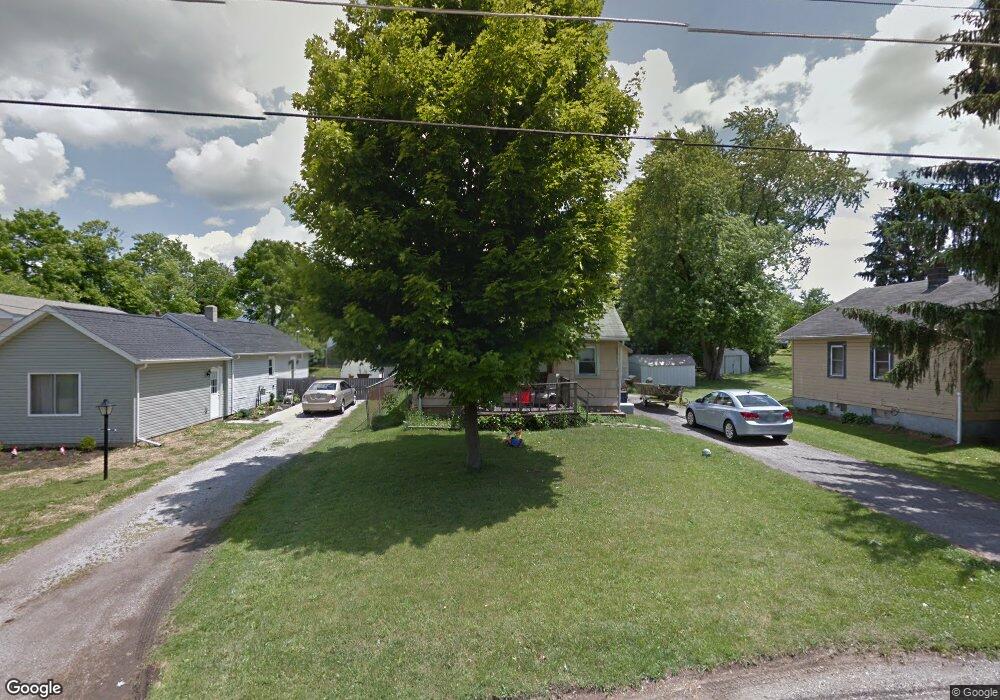
252 6th Ave Mansfield, OH 44905
Estimated Value: $69,727 - $94,000
3
Beds
1
Bath
988
Sq Ft
$85/Sq Ft
Est. Value
About This Home
This home is located at 252 6th Ave, Mansfield, OH 44905 and is currently estimated at $83,682, approximately $84 per square foot. 252 6th Ave is a home located in Richland County with nearby schools including Madison High School, St. Peter's Elementary/Montessori School, and Temple-Christian School.
Ownership History
Date
Name
Owned For
Owner Type
Purchase Details
Closed on
Jun 16, 2016
Sold by
Funk Helen D
Bought by
Funk Michael A
Current Estimated Value
Purchase Details
Closed on
Oct 31, 1996
Sold by
Henry Pamela K
Bought by
Funk Michael A and Funk Helen D
Home Financials for this Owner
Home Financials are based on the most recent Mortgage that was taken out on this home.
Original Mortgage
$34,000
Outstanding Balance
$3,392
Interest Rate
8.23%
Mortgage Type
New Conventional
Estimated Equity
$80,290
Purchase Details
Closed on
Feb 23, 1993
Sold by
Henry Jon D
Bought by
Henry Pamela K
Purchase Details
Closed on
Jan 1, 1987
Create a Home Valuation Report for This Property
The Home Valuation Report is an in-depth analysis detailing your home's value as well as a comparison with similar homes in the area
Home Values in the Area
Average Home Value in this Area
Purchase History
| Date | Buyer | Sale Price | Title Company |
|---|---|---|---|
| Funk Michael A | -- | Attorney | |
| Funk Michael A | $34,000 | -- | |
| Henry Pamela K | -- | -- | |
| -- | $10,000 | -- |
Source: Public Records
Mortgage History
| Date | Status | Borrower | Loan Amount |
|---|---|---|---|
| Open | Funk Michael A | $34,000 |
Source: Public Records
Tax History
| Year | Tax Paid | Tax Assessment Tax Assessment Total Assessment is a certain percentage of the fair market value that is determined by local assessors to be the total taxable value of land and additions on the property. | Land | Improvement |
|---|---|---|---|---|
| 2024 | $412 | $10,450 | $3,650 | $6,800 |
| 2023 | $422 | $10,450 | $3,650 | $6,800 |
| 2022 | $618 | $14,130 | $3,800 | $10,330 |
| 2021 | $617 | $14,130 | $3,800 | $10,330 |
| 2020 | $624 | $14,130 | $3,800 | $10,330 |
| 2019 | $590 | $12,070 | $3,230 | $8,840 |
| 2018 | $584 | $12,070 | $3,230 | $8,840 |
| 2017 | $572 | $12,070 | $3,230 | $8,840 |
| 2016 | $568 | $11,700 | $3,130 | $8,570 |
| 2015 | $557 | $11,700 | $3,130 | $8,570 |
| 2014 | $555 | $11,700 | $3,130 | $8,570 |
| 2012 | $269 | $12,070 | $3,230 | $8,840 |
Source: Public Records
Map
Nearby Homes
Your Personal Tour Guide
Ask me questions while you tour the home.