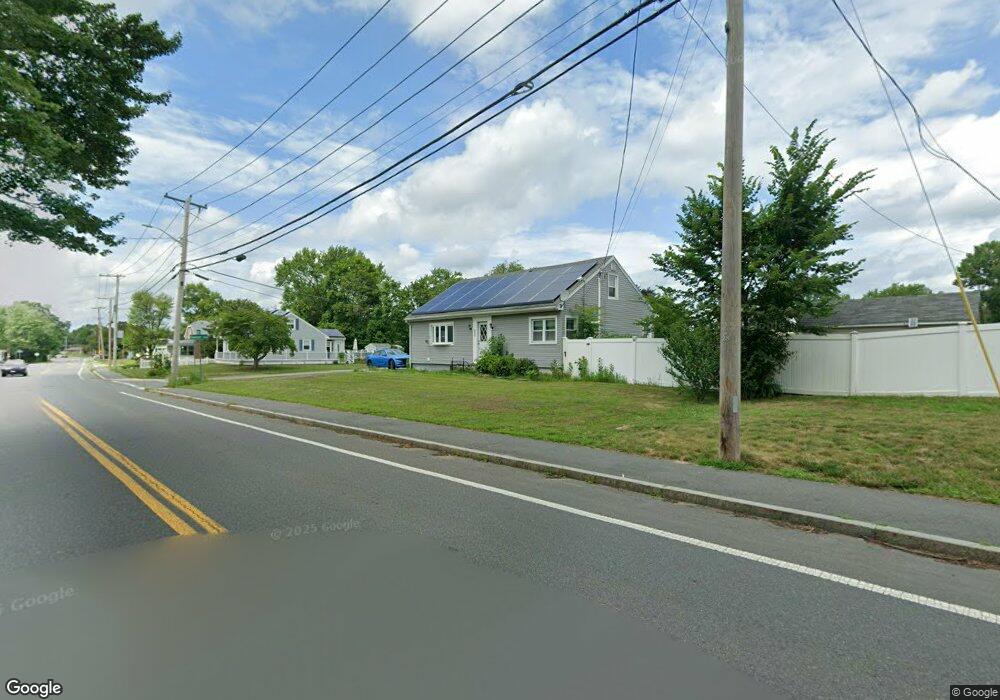
252 Arlington St Dracut, MA 01826
Estimated Value: $524,658 - $561,000
4
Beds
2
Baths
1,548
Sq Ft
$351/Sq Ft
Est. Value
About This Home
This home is located at 252 Arlington St, Dracut, MA 01826 and is currently estimated at $543,165, approximately $350 per square foot. 252 Arlington St is a home located in Middlesex County with nearby schools including Greenmont Avenue School, Richardson Middle School, and Dracut Senior High School.
Ownership History
Date
Name
Owned For
Owner Type
Purchase Details
Closed on
Oct 8, 2024
Sold by
Montgomery Nicole
Bought by
Montogmery Jon M
Current Estimated Value
Purchase Details
Closed on
Oct 19, 2020
Sold by
Montgomery Nicole
Bought by
Montgomery Nicole and Montgomery Jon M
Purchase Details
Closed on
Sep 1, 2011
Sold by
Montgomery Frank H
Bought by
Montgomery Ft
Purchase Details
Closed on
Aug 21, 1985
Bought by
Montgomery Frank M
Create a Home Valuation Report for This Property
The Home Valuation Report is an in-depth analysis detailing your home's value as well as a comparison with similar homes in the area
Home Values in the Area
Average Home Value in this Area
Purchase History
| Date | Buyer | Sale Price | Title Company |
|---|---|---|---|
| Montogmery Jon M | -- | None Available | |
| Montogmery Jon M | -- | None Available | |
| Montgomery Nicole | -- | None Available | |
| Montgomery Nicole | -- | None Available | |
| Montgomery Nicole | -- | None Available | |
| Montgomery Nicole | -- | None Available | |
| Montgomery Ft | -- | -- | |
| Montgomery Frank M | $101,500 | -- | |
| Montgomery Ft | -- | -- |
Source: Public Records
Mortgage History
| Date | Status | Borrower | Loan Amount |
|---|---|---|---|
| Previous Owner | Montgomery Frank M | $130,000 | |
| Previous Owner | Montgomery Frank M | $150,000 | |
| Previous Owner | Montgomery Frank M | $51,000 |
Source: Public Records
Tax History Compared to Growth
Tax History
| Year | Tax Paid | Tax Assessment Tax Assessment Total Assessment is a certain percentage of the fair market value that is determined by local assessors to be the total taxable value of land and additions on the property. | Land | Improvement |
|---|---|---|---|---|
| 2025 | $4,661 | $460,600 | $165,600 | $295,000 |
| 2024 | $4,473 | $428,000 | $157,700 | $270,300 |
| 2023 | $4,314 | $372,500 | $137,100 | $235,400 |
| 2022 | $4,211 | $342,600 | $124,600 | $218,000 |
| 2021 | $4,099 | $315,100 | $113,300 | $201,800 |
| 2020 | $3,960 | $296,600 | $110,000 | $186,600 |
| 2019 | $4,007 | $291,400 | $104,700 | $186,700 |
| 2018 | $3,620 | $256,000 | $104,700 | $151,300 |
| 2017 | $3,380 | $233,100 | $104,700 | $128,400 |
| 2016 | $3,269 | $220,300 | $100,700 | $119,600 |
| 2015 | $3,194 | $213,900 | $100,700 | $113,200 |
| 2014 | $3,027 | $208,900 | $100,700 | $108,200 |
Source: Public Records
Map
Nearby Homes
- 35 Thissell Ave
- 675 Robbins Ave Unit 1
- 700 Robbins Ave Unit 6
- 7 Wildwood St Unit A24
- 650 Robbins Ave Unit 33
- 4 Hazelwood Ave Unit 12
- 575 Beacon St
- 18 Stone St
- 11 View St
- 173 Brook St
- 81 Spring Park Ave
- 315 Broadway Rd Unit 7
- 241 Broadway Rd Unit 50
- 108 Billings St
- 67 Foxhill Ln Unit 67
- 28 May St
- 18 May St
- 1572 Bridge St
- 345 Hildreth St Unit 14
- 2 Sutherland St
- 258 Arlington St
- 13 Sawyer Ave
- 240 Arlington St
- 14 Maille Ave
- 14 Sawyer Ave
- 130 Cheever Ave
- 255 Arlington St
- 20 Maille Ave
- 270 Arlington St
- 234 Arlington St
- 243 Arlington St
- 24 Sawyer Ave
- 11 Maille Ave
- 94 Mailloux Terrace
- 84 Mailloux Terrace
- 19 Maille Ave
- 29 Sawyer Ave
- 235 Arlington St
- 28 Maille Ave
- 30 Maille Ave