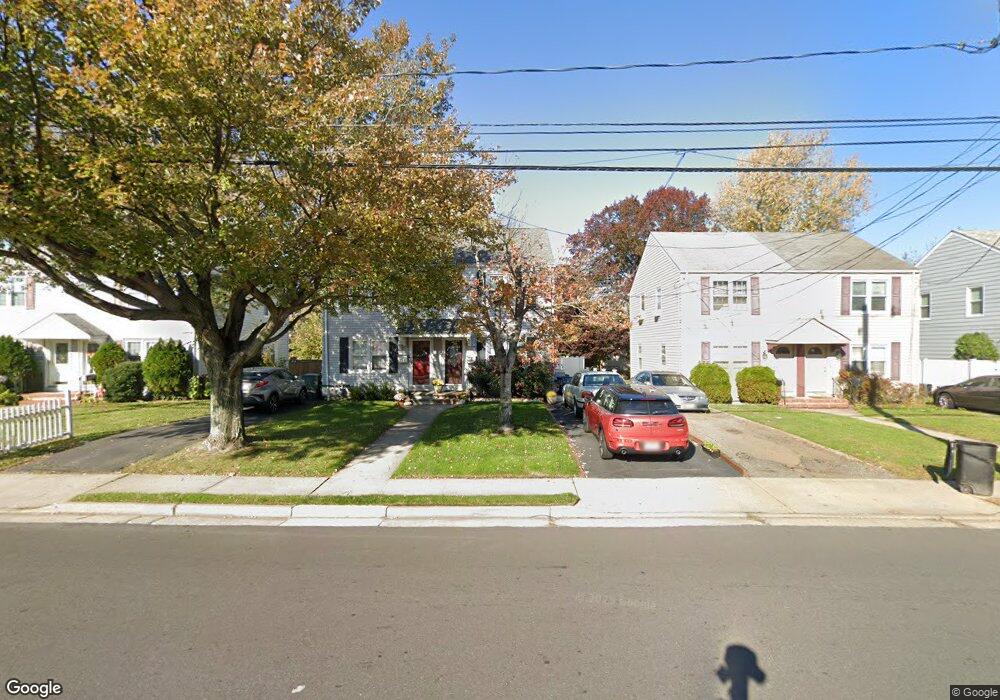
252 Broad St Matawan, NJ 07747
Estimated Value: $343,000 - $411,000
2
Beds
1
Bath
928
Sq Ft
$407/Sq Ft
Est. Value
About This Home
This home is located at 252 Broad St, Matawan, NJ 07747 and is currently estimated at $377,360, approximately $406 per square foot. 252 Broad St is a home located in Monmouth County with nearby schools including Matawan Reg High School, St. Joseph Elementary School, and St Benedict School.
Ownership History
Date
Name
Owned For
Owner Type
Purchase Details
Closed on
Nov 18, 2008
Sold by
Ayyildiz Hikmet
Bought by
Ayyildiz Hikmet and Ayyildiz Fatma
Current Estimated Value
Purchase Details
Closed on
Nov 27, 2006
Sold by
Henderson Shirley
Bought by
Ayyildiz Hikmet
Home Financials for this Owner
Home Financials are based on the most recent Mortgage that was taken out on this home.
Original Mortgage
$189,000
Outstanding Balance
$112,999
Interest Rate
6.31%
Mortgage Type
New Conventional
Estimated Equity
$264,361
Create a Home Valuation Report for This Property
The Home Valuation Report is an in-depth analysis detailing your home's value as well as a comparison with similar homes in the area
Home Values in the Area
Average Home Value in this Area
Purchase History
| Date | Buyer | Sale Price | Title Company |
|---|---|---|---|
| Ayyildiz Hikmet | -- | Renaissance Title Agency | |
| Ayyildiz Hikmet | $210,000 | -- |
Source: Public Records
Mortgage History
| Date | Status | Borrower | Loan Amount |
|---|---|---|---|
| Open | Ayyildiz Hikmet | $189,000 |
Source: Public Records
Tax History
| Year | Tax Paid | Tax Assessment Tax Assessment Total Assessment is a certain percentage of the fair market value that is determined by local assessors to be the total taxable value of land and additions on the property. | Land | Improvement |
|---|---|---|---|---|
| 2025 | $7,189 | $332,600 | $246,200 | $86,400 |
| 2024 | $6,948 | $329,300 | $259,700 | $69,600 |
Source: Public Records
Map
Nearby Homes
- 272 Main St
- 258 Jackson St
- 320 Main St
- 190 Jackson St
- 5 7th St
- 9 Fountain Ave
- 14 New Brunswick Ave
- 8 Sutphin Ave
- 101 Broad St
- 48 Charles St
- 537 S Atlantic Ave
- 326 Sloan Ct Unit 326
- 414 Sloan Ct
- 255 Harding Blvd
- 259 Matawan Ave
- 45 Beechwood Terrace
- 68 Main St
- 101 Ravine Dr
- 10 Johnson Ave
- 55 Wilson Ave
Your Personal Tour Guide
Ask me questions while you tour the home.