Estimated Value: $100,000 - $178,000
3
Beds
1
Bath
1,236
Sq Ft
$114/Sq Ft
Est. Value
About This Home
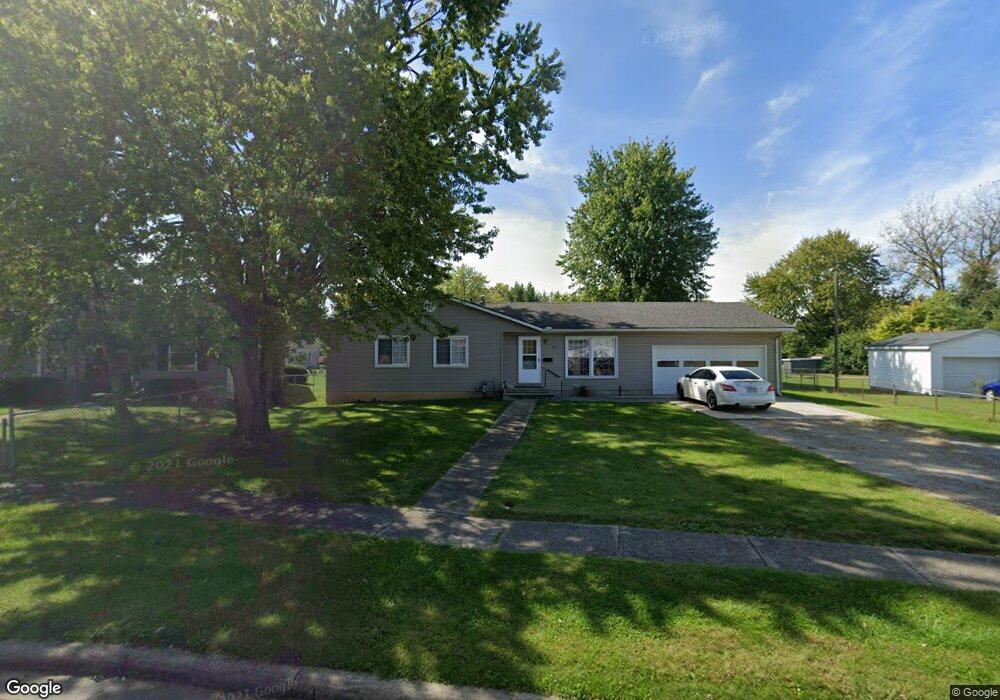
This home is located at 252 Charles St, Xenia, OH 45385 and is currently estimated at $140,855, approximately $113 per square foot. 252 Charles St is a home located in Greene County with nearby schools including Xenia High School, Summit Academy Community School for Alternative Learners - Xenia, and Legacy Christian Academy.
Ownership History
Date
Name
Owned For
Owner Type
Purchase Details
Closed on
Mar 14, 2025
Sold by
Pitzer Joe J and Pitzer Joey J
Bought by
Pitzer Joey J and Pitzer Sheila K
Current Estimated Value
Purchase Details
Closed on
Feb 1, 2008
Sold by
Home Loan Services Inc
Bought by
Pitzer Joe J
Home Financials for this Owner
Home Financials are based on the most recent Mortgage that was taken out on this home.
Original Mortgage
$45,650
Interest Rate
5.75%
Mortgage Type
Unknown
Purchase Details
Closed on
Aug 23, 2007
Sold by
Terrell Norma Gastiger
Bought by
Home Loan Services Inc
Create a Home Valuation Report for This Property
The Home Valuation Report is an in-depth analysis detailing your home's value as well as a comparison with similar homes in the area
Home Values in the Area
Average Home Value in this Area
Purchase History
| Date | Buyer | Sale Price | Title Company |
|---|---|---|---|
| Pitzer Joey J | -- | None Listed On Document | |
| Pitzer Joe J | $50,000 | Home Site Title Agency Inc | |
| Home Loan Services Inc | $52,630 | None Available |
Source: Public Records
Mortgage History
| Date | Status | Borrower | Loan Amount |
|---|---|---|---|
| Previous Owner | Pitzer Joe J | $45,650 |
Source: Public Records
Tax History Compared to Growth
Tax History
| Year | Tax Paid | Tax Assessment Tax Assessment Total Assessment is a certain percentage of the fair market value that is determined by local assessors to be the total taxable value of land and additions on the property. | Land | Improvement |
|---|---|---|---|---|
| 2024 | $1,691 | $39,510 | $6,070 | $33,440 |
| 2023 | $1,691 | $39,510 | $6,070 | $33,440 |
| 2022 | $1,486 | $29,630 | $4,860 | $24,770 |
| 2021 | $1,506 | $29,630 | $4,860 | $24,770 |
| 2020 | $1,443 | $29,630 | $4,860 | $24,770 |
| 2019 | $1,290 | $24,930 | $5,900 | $19,030 |
| 2018 | $1,295 | $24,930 | $5,900 | $19,030 |
| 2017 | $1,319 | $24,930 | $5,900 | $19,030 |
| 2016 | $1,320 | $24,930 | $5,900 | $19,030 |
| 2015 | $1,323 | $24,930 | $5,900 | $19,030 |
| 2014 | $1,267 | $24,930 | $5,900 | $19,030 |
Source: Public Records
Map
Nearby Homes