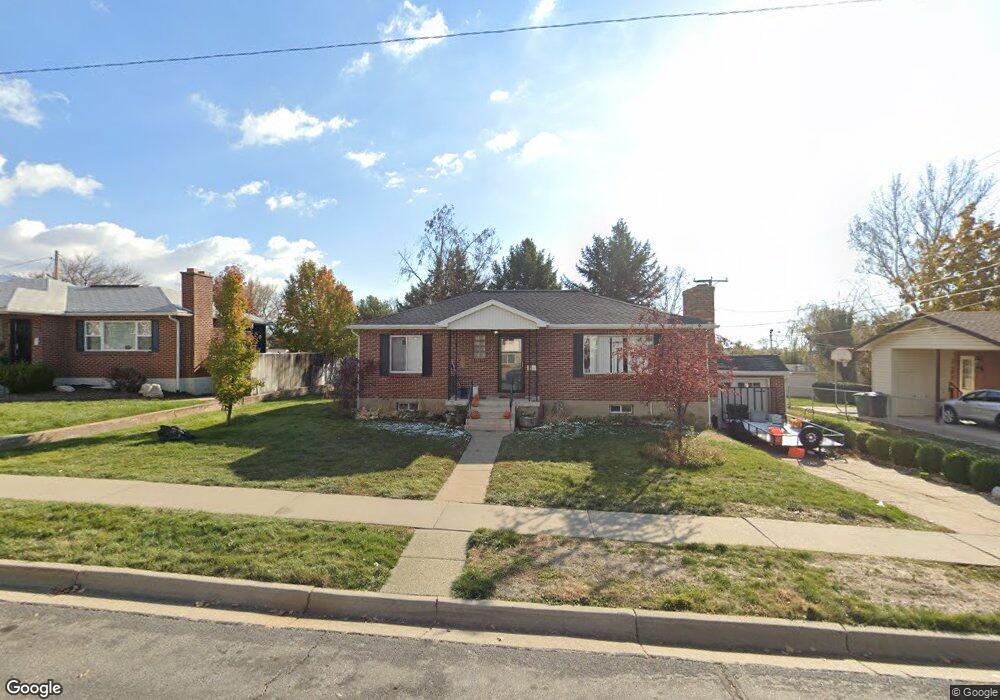
252 E 100 N Kaysville, UT 84037
Estimated Value: $472,000 - $567,000
4
Beds
3
Baths
2,173
Sq Ft
$237/Sq Ft
Est. Value
About This Home
This home is located at 252 E 100 N, Kaysville, UT 84037 and is currently estimated at $515,189, approximately $237 per square foot. 252 E 100 N is a home located in Davis County with nearby schools including Kaysville Elementary School, Kaysville Junior High School, and Davis High School.
Ownership History
Date
Name
Owned For
Owner Type
Purchase Details
Closed on
Aug 3, 2017
Sold by
Cartus Financial Corp
Bought by
Bingham Jennifer A and Bingham Ryan M
Current Estimated Value
Home Financials for this Owner
Home Financials are based on the most recent Mortgage that was taken out on this home.
Original Mortgage
$261,300
Outstanding Balance
$218,445
Interest Rate
4.03%
Mortgage Type
New Conventional
Estimated Equity
$296,744
Purchase Details
Closed on
Jul 29, 2017
Sold by
Lott Jeffrey A and Lott Debra A
Bought by
Cartus Financial Corp
Home Financials for this Owner
Home Financials are based on the most recent Mortgage that was taken out on this home.
Original Mortgage
$261,300
Outstanding Balance
$218,445
Interest Rate
4.03%
Mortgage Type
New Conventional
Estimated Equity
$296,744
Purchase Details
Closed on
Sep 12, 2016
Sold by
Iott Debra A and Iott Jeffrey A
Bought by
Ridd Weston
Purchase Details
Closed on
May 28, 1999
Sold by
Nichkerson Abe P and Nickerson Marie L
Bought by
Nickerson Abe P and Nickerson Marie L
Create a Home Valuation Report for This Property
The Home Valuation Report is an in-depth analysis detailing your home's value as well as a comparison with similar homes in the area
Home Values in the Area
Average Home Value in this Area
Purchase History
| Date | Buyer | Sale Price | Title Company |
|---|---|---|---|
| Bingham Jennifer A | -- | -- | |
| Cartus Financial Corp | -- | -- | |
| Ridd Weston | -- | Security Title | |
| Nickerson Abe P | -- | -- |
Source: Public Records
Mortgage History
| Date | Status | Borrower | Loan Amount |
|---|---|---|---|
| Open | Bingham Jennifer A | $261,300 |
Source: Public Records
Tax History Compared to Growth
Tax History
| Year | Tax Paid | Tax Assessment Tax Assessment Total Assessment is a certain percentage of the fair market value that is determined by local assessors to be the total taxable value of land and additions on the property. | Land | Improvement |
|---|---|---|---|---|
| 2024 | $2,603 | $274,450 | $132,231 | $142,219 |
| 2023 | $2,565 | $479,000 | $228,839 | $250,161 |
| 2022 | $2,599 | $272,250 | $123,218 | $149,032 |
| 2021 | $2,427 | $381,000 | $168,399 | $212,601 |
| 2020 | $2,132 | $326,000 | $140,227 | $185,773 |
| 2019 | $1,925 | $289,000 | $165,385 | $123,615 |
| 2018 | $1,764 | $264,000 | $144,845 | $119,155 |
| 2016 | $1,266 | $99,605 | $35,429 | $64,176 |
| 2015 | $1,225 | $91,520 | $35,429 | $56,091 |
| 2014 | $117 | $89,930 | $35,429 | $54,501 |
| 2013 | -- | $83,165 | $22,966 | $60,199 |
Source: Public Records
Map
Nearby Homes