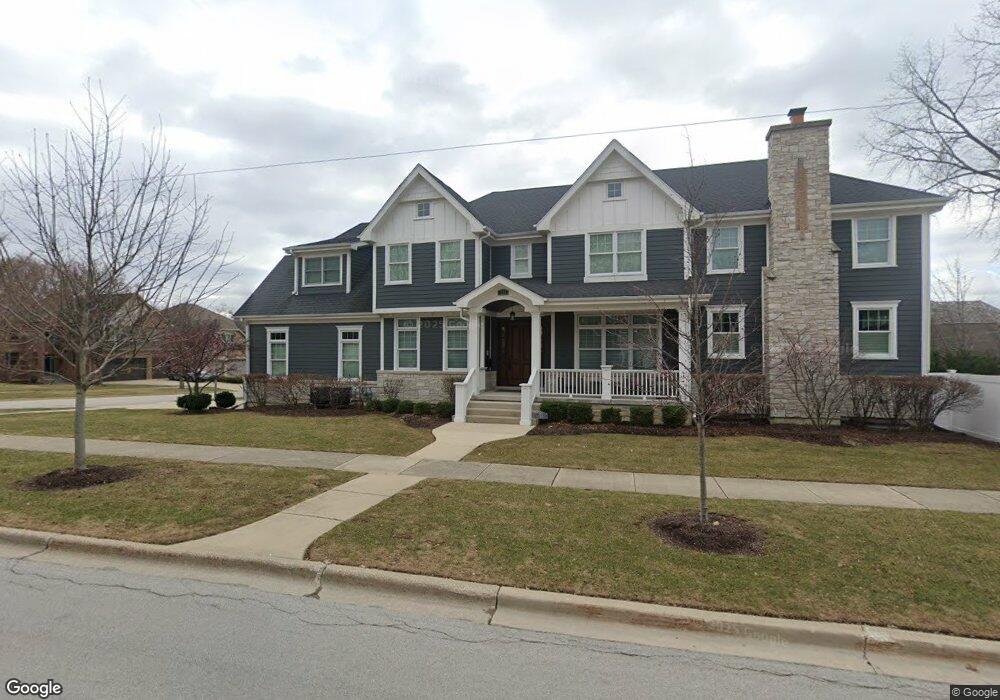
252 E Van Buren St Elmhurst, IL 60126
Estimated Value: $1,470,710 - $1,674,000
6
Beds
5
Baths
4,276
Sq Ft
$371/Sq Ft
Est. Value
About This Home
This home is located at 252 E Van Buren St, Elmhurst, IL 60126 and is currently estimated at $1,585,928, approximately $370 per square foot. 252 E Van Buren St is a home located in DuPage County with nearby schools including Jefferson Elementary School, Bryan Middle School, and York Community High School.
Ownership History
Date
Name
Owned For
Owner Type
Purchase Details
Closed on
Mar 15, 2025
Sold by
Almodovar Joe and Maira Roman
Bought by
Maira Roman Trust and Joe Almodovar Trust
Current Estimated Value
Purchase Details
Closed on
Apr 25, 2008
Sold by
Crescio Linda M
Bought by
Almodovar Joe and Almodovar Maira Roman
Home Financials for this Owner
Home Financials are based on the most recent Mortgage that was taken out on this home.
Original Mortgage
$220,000
Interest Rate
5.88%
Mortgage Type
Purchase Money Mortgage
Purchase Details
Closed on
Nov 23, 2007
Sold by
Crescio Donald W
Bought by
Crescio Donald W and Crescio Linda M
Purchase Details
Closed on
Dec 2, 1998
Sold by
Musich Jean
Bought by
Crescio Donald W
Create a Home Valuation Report for This Property
The Home Valuation Report is an in-depth analysis detailing your home's value as well as a comparison with similar homes in the area
Home Values in the Area
Average Home Value in this Area
Purchase History
| Date | Buyer | Sale Price | Title Company |
|---|---|---|---|
| Maira Roman Trust | -- | None Listed On Document | |
| Almodovar Joe | $275,000 | First American Title | |
| Crescio Donald W | -- | None Available | |
| Crescio Donald W | $161,500 | -- |
Source: Public Records
Mortgage History
| Date | Status | Borrower | Loan Amount |
|---|---|---|---|
| Previous Owner | Almodovar Joe | $220,000 |
Source: Public Records
Tax History
| Year | Tax Paid | Tax Assessment Tax Assessment Total Assessment is a certain percentage of the fair market value that is determined by local assessors to be the total taxable value of land and additions on the property. | Land | Improvement |
|---|---|---|---|---|
| 2024 | $24,042 | $411,935 | $106,961 | $304,974 |
| 2023 | $25,020 | $420,130 | $98,910 | $321,220 |
| 2022 | $28,071 | $468,920 | $95,070 | $373,850 |
| 2021 | $27,391 | $457,260 | $92,710 | $364,550 |
| 2020 | $26,346 | $447,240 | $90,680 | $356,560 |
| 2019 | $25,822 | $425,210 | $86,210 | $339,000 |
| 2018 | $23,499 | $385,310 | $81,620 | $303,690 |
| 2017 | $23,012 | $367,170 | $77,780 | $289,390 |
| 2016 | $22,562 | $345,890 | $73,270 | $272,620 |
| 2015 | $13,507 | $68,260 | $68,260 | $0 |
| 2014 | $4,477 | $64,100 | $54,180 | $9,920 |
| 2013 | $4,611 | $67,390 | $54,940 | $12,450 |
Source: Public Records
Map
Nearby Homes
- 918 S Cambridge Ave
- 927 S Chatham Ave
- 323 E Butterfield Rd
- 837 S Kearsage Ave
- 906 S Kirk Ave
- 788 S Cambridge Ave
- 857 S Euclid Ave
- 15W320 Concord St
- 928 S Hillcrest Ave
- 881 S Bryan St
- 110 W Butterfield Rd Unit 502S
- 160 E Cayuga Ave
- 878 S Parkside Ave
- 171 E Cayuga Ave
- 274 E Crescent Ave
- 956 S Cadwell Ave
- 522 E Park Manor Ct
- 769 S Prospect Ave
- 936 S Mitchell Ave
- 680 S Bryan St
- 898 S Chatham Ave
- 900 S Chatham Ave
- 238 E Van Buren St
- 245 E Van Buren St
- 251 E Van Buren St
- 909 S Cambridge Ave
- 904 S Chatham Ave
- 241 E Van Buren St
- 915 S Cambridge Ave
- 908 S Chatham Ave
- 880 S Chatham Ave
- 895 S Chatham Ave
- 899 S Chatham Ave
- 919 S Cambridge Ave
- 237 E Van Buren St
- 903 S Chatham Ave
- 885 S Cambridge Ave
- 881 S Chatham Ave
- 874 S Chatham Ave
- 907 S Chatham Ave
Your Personal Tour Guide
Ask me questions while you tour the home.