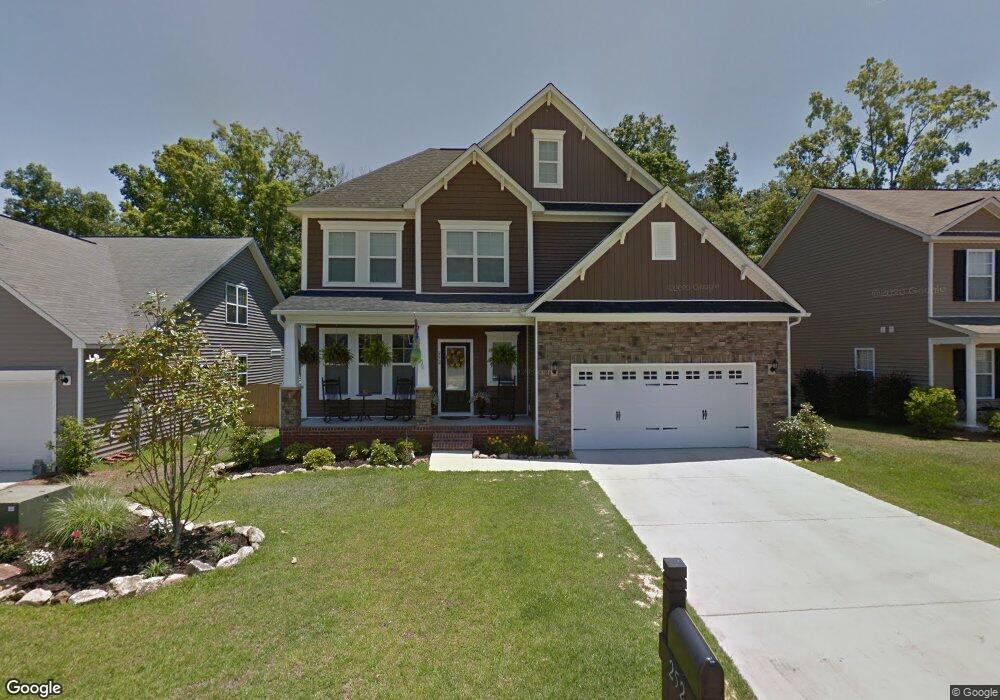
252 Eagle Pointe Dr Chapin, SC 29036
Estimated Value: $289,000 - $366,000
4
Beds
3
Baths
2,340
Sq Ft
$137/Sq Ft
Est. Value
About This Home
This home is located at 252 Eagle Pointe Dr, Chapin, SC 29036 and is currently estimated at $321,281, approximately $137 per square foot. 252 Eagle Pointe Dr is a home located in Lexington County with nearby schools including Chapin Elementary School, Chapin Intermediate, and Chapin High School.
Ownership History
Date
Name
Owned For
Owner Type
Purchase Details
Closed on
Jul 22, 2017
Sold by
Beasley Terry M and Beasley Mark K
Bought by
Coward Bryan and Coward Jodie
Current Estimated Value
Home Financials for this Owner
Home Financials are based on the most recent Mortgage that was taken out on this home.
Original Mortgage
$183,150
Outstanding Balance
$154,133
Interest Rate
4.37%
Mortgage Type
FHA
Estimated Equity
$167,148
Purchase Details
Closed on
Jul 18, 2012
Sold by
Mungo Homes Inc
Bought by
Beasley Terry M and Beasley Mary K
Home Financials for this Owner
Home Financials are based on the most recent Mortgage that was taken out on this home.
Original Mortgage
$171,428
Interest Rate
3.7%
Mortgage Type
Future Advance Clause Open End Mortgage
Purchase Details
Closed on
Jan 24, 2011
Sold by
Chapin New Town Llc
Bought by
Mungo Homes Inc
Home Financials for this Owner
Home Financials are based on the most recent Mortgage that was taken out on this home.
Original Mortgage
$35,000,000
Interest Rate
4.58%
Mortgage Type
New Conventional
Create a Home Valuation Report for This Property
The Home Valuation Report is an in-depth analysis detailing your home's value as well as a comparison with similar homes in the area
Home Values in the Area
Average Home Value in this Area
Purchase History
| Date | Buyer | Sale Price | Title Company |
|---|---|---|---|
| Coward Bryan | $200,000 | None Available | |
| Beasley Terry M | $168,000 | -- | |
| Mungo Homes Inc | $705,000 | -- |
Source: Public Records
Mortgage History
| Date | Status | Borrower | Loan Amount |
|---|---|---|---|
| Open | Coward Bryan | $183,150 | |
| Previous Owner | Beasley Terry M | $171,428 | |
| Previous Owner | Mungo Homes Inc | $35,000,000 |
Source: Public Records
Tax History
| Year | Tax Paid | Tax Assessment Tax Assessment Total Assessment is a certain percentage of the fair market value that is determined by local assessors to be the total taxable value of land and additions on the property. | Land | Improvement |
|---|---|---|---|---|
| 2024 | $1,326 | $8,052 | $1,000 | $7,052 |
| 2023 | $1,231 | $8,052 | $1,000 | $7,052 |
| 2022 | $1,243 | $8,052 | $1,000 | $7,052 |
| 2020 | $1,301 | $8,052 | $1,000 | $7,052 |
| 2019 | $1,316 | $8,000 | $1,000 | $7,000 |
| 2018 | $1,158 | $8,000 | $1,000 | $7,000 |
| 2017 | $911 | $6,461 | $1,000 | $5,461 |
| 2016 | $934 | $6,460 | $1,000 | $5,460 |
| 2014 | $968 | $6,719 | $1,000 | $5,719 |
| 2013 | -- | $6,720 | $1,000 | $5,720 |
Source: Public Records
Map
Nearby Homes
- 147 State Road S-32-716
- 814 Dutchmaster Dr
- 160 State Road S-32-716
- 392 Eagle Pointe Dr
- 720 Topline St
- 1661 Old Lexington Hwy
- 153 Rushton Dr
- 1533 Saugus Ct
- 312 Throne Ct
- 366 Gallery Cliff Dr
- 512 Old Bush River Rd
- 228 Bickley View Ct
- 271 Bickley View Ct
- 358 Chapin Place Way
- 354 Chapin Place Way
- 627 Basalt Ct
- 621 Basalt Ct
- 350 Chapin Place Way
- 368 Frick Ct
- 339 Newberg Rd
- 254 Eagle Pointe Dr
- 250 Eagle Pointe Dr
- 248 Eagle Pointe Dr
- 256 Eagle Pointe Dr
- 253 Eagle Pointe Dr
- 246 Eagle Pointe Dr
- 258 Eagle Pointe Dr
- 265 Eagle Pointe Dr
- 244 Eagle Pointe Dr
- 179 Wingspan Way
- 262 Eagle Pointe Dr
- 301 Eagle Pointe Dr
- 180 Wingspan Way
- 180 Wingspan Way
- 177 Wingspan Way
- 242 Eagle Pointe Dr
- 266 Eagle Pointe Dr
- 305 Eagle Pointe Dr
- 178 Wingspan Way
- 175 Wingspan Way
Your Personal Tour Guide
Ask me questions while you tour the home.