Estimated Value: $218,000 - $232,663
2
Beds
3
Baths
1,712
Sq Ft
$133/Sq Ft
Est. Value
About This Home
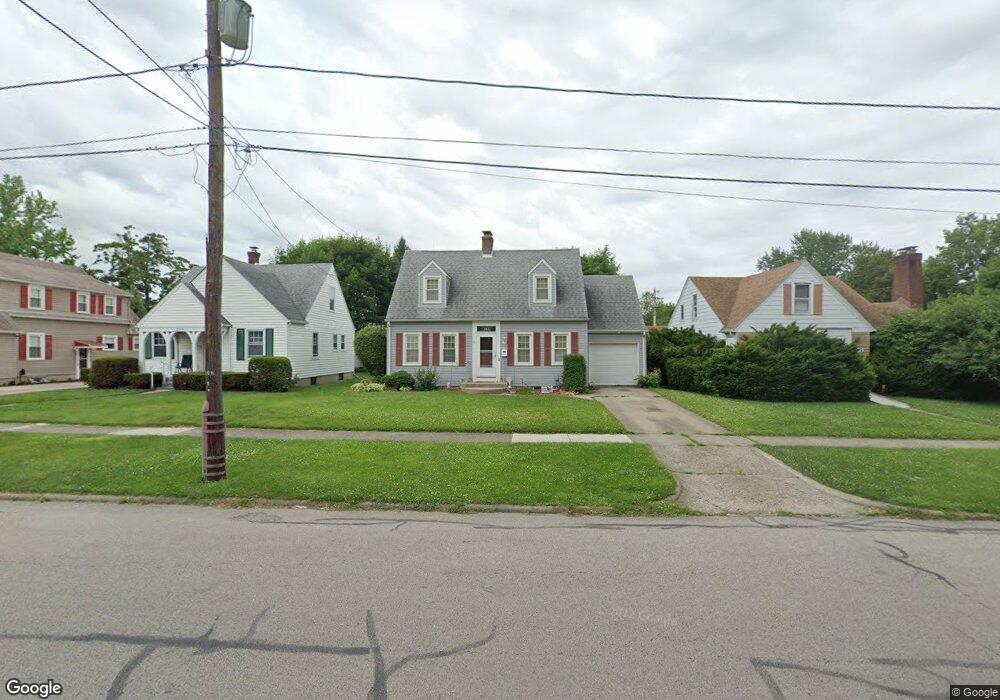
This home is located at 252 Edison Blvd, Xenia, OH 45385 and is currently estimated at $227,666, approximately $132 per square foot. 252 Edison Blvd is a home located in Greene County with nearby schools including Xenia High School, Summit Academy Community School for Alternative Learners - Xenia, and Legacy Christian Academy.
Ownership History
Date
Name
Owned For
Owner Type
Purchase Details
Closed on
Apr 25, 2003
Sold by
Smith Michelle M and Smith Wesley E
Bought by
Hull Robert E and Hull Melinda J
Current Estimated Value
Home Financials for this Owner
Home Financials are based on the most recent Mortgage that was taken out on this home.
Original Mortgage
$98,300
Interest Rate
5.71%
Purchase Details
Closed on
May 22, 2001
Sold by
Smith Wesley E and Smith Michelle M
Bought by
Smith Michelle M
Home Financials for this Owner
Home Financials are based on the most recent Mortgage that was taken out on this home.
Original Mortgage
$104,000
Interest Rate
7.16%
Purchase Details
Closed on
Aug 6, 1998
Sold by
Harvey Ronald L and Harvey Sandra G
Bought by
Smith Wesley E and Smith Michelle M
Home Financials for this Owner
Home Financials are based on the most recent Mortgage that was taken out on this home.
Original Mortgage
$106,300
Interest Rate
7.05%
Create a Home Valuation Report for This Property
The Home Valuation Report is an in-depth analysis detailing your home's value as well as a comparison with similar homes in the area
Home Values in the Area
Average Home Value in this Area
Purchase History
| Date | Buyer | Sale Price | Title Company |
|---|---|---|---|
| Hull Robert E | $122,900 | -- | |
| Smith Michelle M | -- | -- | |
| Smith Wesley E | $111,900 | -- |
Source: Public Records
Mortgage History
| Date | Status | Borrower | Loan Amount |
|---|---|---|---|
| Closed | Hull Robert E | $98,300 | |
| Closed | Smith Michelle M | $104,000 | |
| Closed | Smith Wesley E | $106,300 | |
| Closed | Hull Robert E | $22,000 |
Source: Public Records
Tax History
| Year | Tax Paid | Tax Assessment Tax Assessment Total Assessment is a certain percentage of the fair market value that is determined by local assessors to be the total taxable value of land and additions on the property. | Land | Improvement |
|---|---|---|---|---|
| 2025 | $2,665 | $62,740 | $8,230 | $54,510 |
| 2024 | $2,665 | $62,740 | $8,230 | $54,510 |
| 2023 | $2,616 | $62,740 | $8,230 | $54,510 |
| 2022 | $2,265 | $46,310 | $5,150 | $41,160 |
| 2021 | $2,295 | $46,310 | $5,150 | $41,160 |
| 2020 | $2,197 | $46,310 | $5,150 | $41,160 |
| 2019 | $2,338 | $46,400 | $4,950 | $41,450 |
| 2018 | $2,348 | $46,400 | $4,950 | $41,450 |
| 2017 | $2,279 | $46,400 | $4,950 | $41,450 |
| 2016 | $2,101 | $40,770 | $4,950 | $35,820 |
| 2015 | $2,107 | $40,770 | $4,950 | $35,820 |
| 2014 | $2,015 | $40,770 | $4,950 | $35,820 |
Source: Public Records
Map
Nearby Homes
- 262 Edison Blvd
- 236 Edison Blvd
- 224 Edison Blvd
- 150 Sheridan Ave
- 214 Edison Blvd
- 292 Edison Blvd
- 140 Sheridan Ave
- 247 Edison Blvd
- 261 Edison Blvd
- 128 Sheridan Ave
- 235 Edison Blvd
- 304 Edison Blvd
- 120 Sheridan Ave
- 225 Edison Blvd
- 108 Sheridan Ave
- 316 Edison Blvd
- 221 Garfield Ave
- 222 Hayes Ave
- 129 Park Dr
- 141 Park Dr
Your Personal Tour Guide
Ask me questions while you tour the home.