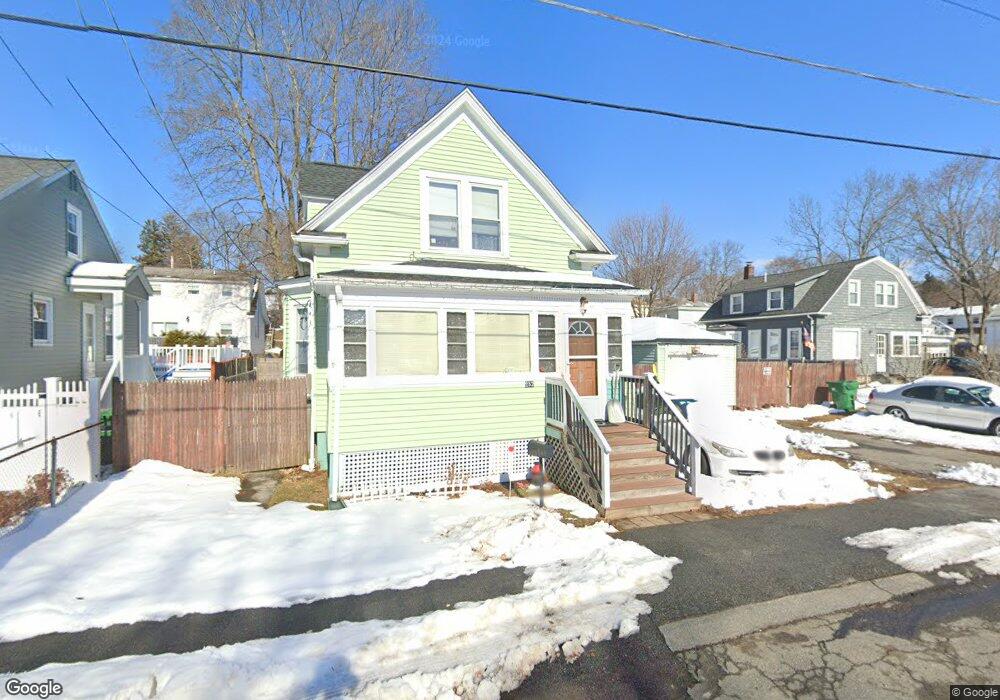
252 Gaston St Medford, MA 02155
North Medford NeighborhoodEstimated Value: $612,000 - $655,000
3
Beds
1
Bath
1,338
Sq Ft
$474/Sq Ft
Est. Value
About This Home
This home is located at 252 Gaston St, Medford, MA 02155 and is currently estimated at $633,680, approximately $473 per square foot. 252 Gaston St is a home located in Middlesex County with nearby schools including Medford High School, Mystic Valley Regional Charter School, and Cheverus Catholic School.
Ownership History
Date
Name
Owned For
Owner Type
Purchase Details
Closed on
May 3, 2024
Sold by
Malyerck Barbara A and Malyerck Gordon M
Bought by
Malyerck Barbara A and Malyerck Gordon M
Current Estimated Value
Purchase Details
Closed on
Jun 12, 2012
Sold by
Hayes Christine
Bought by
Maleryck Gordon M and Maleryck Barbara
Purchase Details
Closed on
Mar 7, 2006
Sold by
Malyerck Barbara and Hayes Christine
Bought by
Malyerck Barbara and Hayes Christine
Create a Home Valuation Report for This Property
The Home Valuation Report is an in-depth analysis detailing your home's value as well as a comparison with similar homes in the area
Home Values in the Area
Average Home Value in this Area
Purchase History
| Date | Buyer | Sale Price | Title Company |
|---|---|---|---|
| Malyerck Barbara A | -- | None Available | |
| Malyerck Ft | -- | None Available | |
| Malyerck Barbara A | -- | None Available | |
| Maleryck Gordon M | -- | -- | |
| Maleryck Gordon M | -- | -- | |
| Malyerck Barbara | -- | -- | |
| Malyerck Barbara | -- | -- |
Source: Public Records
Tax History Compared to Growth
Tax History
| Year | Tax Paid | Tax Assessment Tax Assessment Total Assessment is a certain percentage of the fair market value that is determined by local assessors to be the total taxable value of land and additions on the property. | Land | Improvement |
|---|---|---|---|---|
| 2025 | $4,406 | $517,100 | $296,700 | $220,400 |
| 2024 | $4,406 | $517,100 | $296,700 | $220,400 |
| 2023 | $4,232 | $489,200 | $277,300 | $211,900 |
| 2022 | $3,952 | $438,600 | $252,100 | $186,500 |
| 2021 | $3,930 | $417,600 | $240,100 | $177,500 |
| 2020 | $3,864 | $420,900 | $240,100 | $180,800 |
| 2019 | $3,713 | $386,800 | $218,300 | $168,500 |
| 2018 | $3,506 | $342,400 | $198,400 | $144,000 |
| 2017 | $3,322 | $314,600 | $185,500 | $129,100 |
| 2016 | $3,181 | $284,300 | $168,600 | $115,700 |
Source: Public Records
Map
Nearby Homes