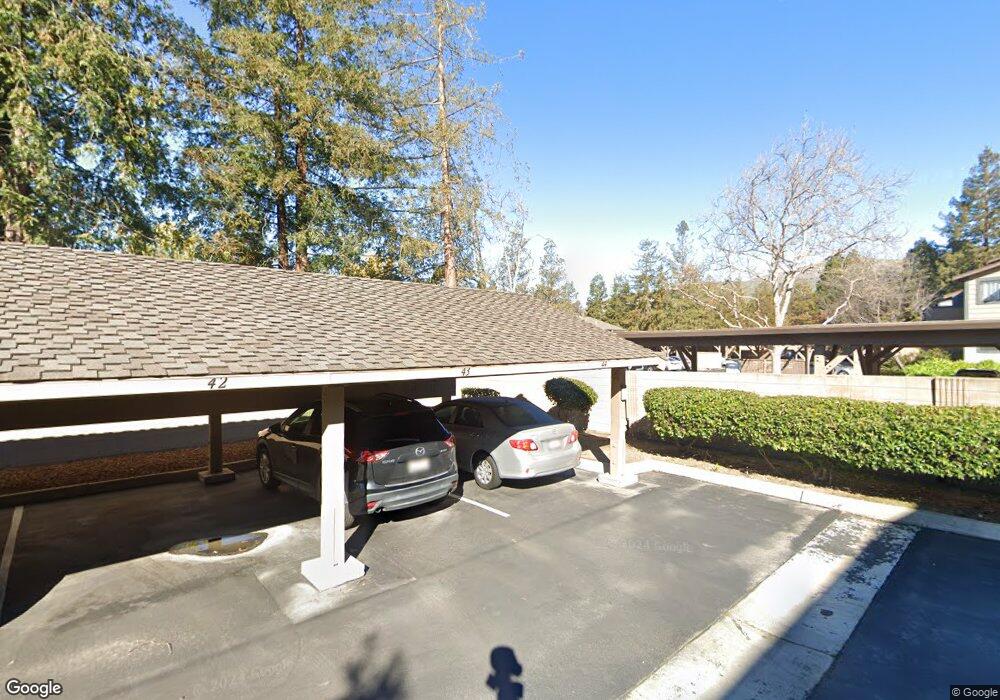
252 Hackamore Common Fremont, CA 94539
Warm Springs NeighborhoodEstimated Value: $549,624 - $618,000
2
Beds
1
Bath
878
Sq Ft
$662/Sq Ft
Est. Value
About This Home
This home is located at 252 Hackamore Common, Fremont, CA 94539 and is currently estimated at $581,656, approximately $662 per square foot. 252 Hackamore Common is a home located in Alameda County with nearby schools including James Leitch Elementary School, Warm Springs Elementary School, and John M. Horner Junior High School.
Ownership History
Date
Name
Owned For
Owner Type
Purchase Details
Closed on
Nov 18, 2016
Sold by
Jacobs Roberson Paulette and Roberson William A
Bought by
Roberson William A and Jacobs Roberson Paulette
Current Estimated Value
Create a Home Valuation Report for This Property
The Home Valuation Report is an in-depth analysis detailing your home's value as well as a comparison with similar homes in the area
Home Values in the Area
Average Home Value in this Area
Purchase History
| Date | Buyer | Sale Price | Title Company |
|---|---|---|---|
| Roberson William A | -- | None Available |
Source: Public Records
Tax History
| Year | Tax Paid | Tax Assessment Tax Assessment Total Assessment is a certain percentage of the fair market value that is determined by local assessors to be the total taxable value of land and additions on the property. | Land | Improvement |
|---|---|---|---|---|
| 2025 | $2,696 | $178,174 | $46,615 | $131,559 |
| 2024 | $2,696 | $174,680 | $45,701 | $128,979 |
| 2023 | $2,609 | $171,256 | $44,805 | $126,451 |
| 2022 | $2,554 | $167,899 | $43,927 | $123,972 |
| 2021 | $2,503 | $164,606 | $43,065 | $121,541 |
| 2020 | $2,428 | $162,919 | $42,624 | $120,295 |
| 2019 | $2,404 | $159,725 | $41,788 | $117,937 |
| 2018 | $2,355 | $156,594 | $40,969 | $115,625 |
| 2017 | $2,297 | $153,524 | $40,166 | $113,358 |
| 2016 | $2,246 | $150,513 | $39,378 | $111,135 |
| 2015 | $2,203 | $148,254 | $38,787 | $109,467 |
| 2014 | $2,164 | $145,350 | $38,027 | $107,323 |
Source: Public Records
Map
Nearby Homes
- 277 Hackamore Common
- 47101 Benns Terrace
- 304 Hackamore Ln Unit 124
- 152 Hackamore Ln Unit 8
- 134 Hackamore Ln
- 47112 Warm Springs Blvd Unit 225
- 161 Hackamore Ln
- 162 Shaniko Common Unit 66
- 93 Shaniko Common Unit 24
- 46902 Fernald Common
- 78 Shaniko Common
- 195 Carson Falls Common
- 46636 Winema Common
- 769 Covina Way
- 47507 Fortner St
- 437 Hollow Falls Common
- 803 Ulmeca Place
- 46811 Agave Ct
- 466 Crystalline Dr
- 48252 Cottonwood St
- 254 Hackamore Common
- 226 Hackamore Common
- 248 Hackamore Common
- 250 Hackamore Common
- 224 Hackamore Common
- 230 Hackamore Common Unit 2
- 272 Hackamore Common Unit 112
- 228 Hackamore Common
- 246 Hackamore Common Unit 95
- 244 Hackamore Common Unit 87
- 234 Hackamore Common
- 191 E Warren Common
- 232 Hackamore Common
- 193 E Warren Common
- 192 Hackamore Common
- 189 E Warren Common
- 194 Hackamore Common
- 242 Hackamore Common
- 240 Hackamore Common
- 190 Hackamore Common
Your Personal Tour Guide
Ask me questions while you tour the home.