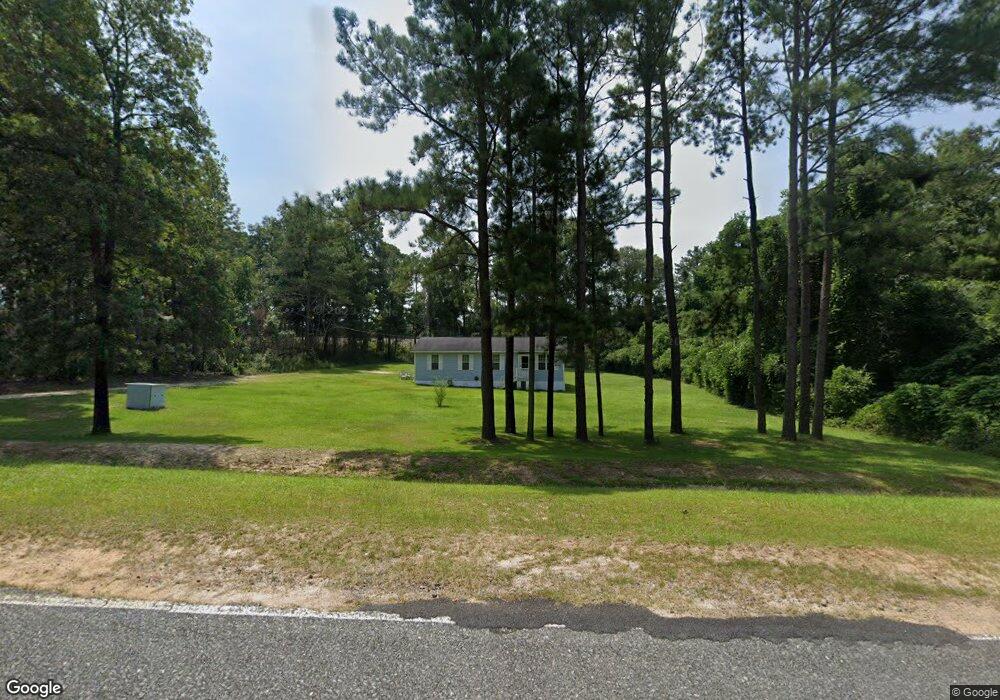
252 Hicks Rd Reynolds, GA 31076
Estimated Value: $208,000 - $444,000
3
Beds
2
Baths
1,700
Sq Ft
$176/Sq Ft
Est. Value
About This Home
This home is located at 252 Hicks Rd, Reynolds, GA 31076 and is currently estimated at $298,993, approximately $175 per square foot. 252 Hicks Rd is a home located in Taylor County with nearby schools including Taylor County Upper Elementary School, Taylor County Primary School, and Taylor County Middle School.
Ownership History
Date
Name
Owned For
Owner Type
Purchase Details
Closed on
Mar 26, 2014
Sold by
Eide Aaron Spencer
Bought by
Bullington Christopher A
Current Estimated Value
Home Financials for this Owner
Home Financials are based on the most recent Mortgage that was taken out on this home.
Original Mortgage
$105,000
Interest Rate
4.4%
Mortgage Type
VA
Purchase Details
Closed on
Jun 14, 2012
Sold by
Federal Home Loan Mortgage Corporation
Bought by
Eide Aaron Spencer and Eide Angela R
Home Financials for this Owner
Home Financials are based on the most recent Mortgage that was taken out on this home.
Original Mortgage
$91,935
Interest Rate
3.83%
Mortgage Type
VA
Purchase Details
Closed on
Aug 19, 1998
Sold by
Williams Betty S
Bought by
Williams Jackie
Purchase Details
Closed on
Apr 17, 1990
Bought by
Williams Jackie
Create a Home Valuation Report for This Property
The Home Valuation Report is an in-depth analysis detailing your home's value as well as a comparison with similar homes in the area
Home Values in the Area
Average Home Value in this Area
Purchase History
| Date | Buyer | Sale Price | Title Company |
|---|---|---|---|
| Bullington Christopher A | $105,000 | -- | |
| Eide Aaron Spencer | -- | -- | |
| Williams Jackie | -- | -- | |
| Williams Jackie | $6,500 | -- |
Source: Public Records
Mortgage History
| Date | Status | Borrower | Loan Amount |
|---|---|---|---|
| Open | Bullington Christopher A | $105,000 | |
| Previous Owner | Eide Aaron Spencer | $91,935 |
Source: Public Records
Tax History Compared to Growth
Tax History
| Year | Tax Paid | Tax Assessment Tax Assessment Total Assessment is a certain percentage of the fair market value that is determined by local assessors to be the total taxable value of land and additions on the property. | Land | Improvement |
|---|---|---|---|---|
| 2024 | $1,972 | $93,304 | $19,200 | $74,104 |
| 2023 | $1,701 | $75,944 | $16,720 | $59,224 |
| 2022 | $1,544 | $67,224 | $10,960 | $56,264 |
| 2021 | $1,457 | $61,904 | $9,120 | $52,784 |
| 2020 | $1,377 | $58,024 | $9,120 | $48,904 |
| 2019 | $1,399 | $58,024 | $9,120 | $48,904 |
| 2018 | $1,397 | $58,024 | $9,120 | $48,904 |
| 2017 | $1,153 | $48,445 | $11,074 | $37,371 |
| 2016 | $1,161 | $48,445 | $11,074 | $37,371 |
| 2015 | -- | $48,445 | $11,074 | $37,371 |
| 2014 | -- | $52,222 | $12,304 | $39,918 |
| 2013 | -- | $52,721 | $12,304 | $40,416 |
Source: Public Records
Map
Nearby Homes
- 0 Hicks Rd Unit LOT 1 10585746
- 0 Hicks Rd Unit 23374480
- 0 Oak Ridge Dr
- 160 Underwood Rd
- 129 Gaultney-Horne Rd
- 25 W Marion St
- 46 S Collins St
- 30 Potterville Main St
- 30 Pottervile Main St
- 46 E Calhoun St
- 29 Mimms St
- 0 Macon Rd Unit 24182740
- 0 Macon Rd Unit 10564691
- 8 Laurel St
- 13 Marshall St
- 171 Thomas Rd
- 82 Hollie St
- 0 Thomas Rd