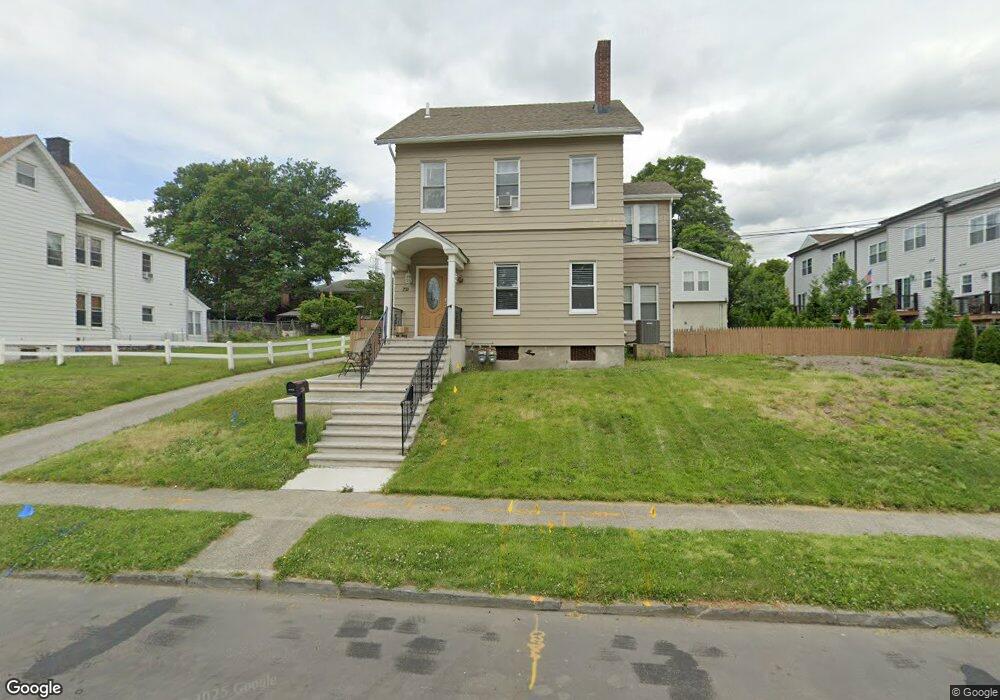
252 Main St South Amboy, NJ 08879
Estimated Value: $552,000 - $679,000
5
Beds
3
Baths
1,920
Sq Ft
$318/Sq Ft
Est. Value
About This Home
This home is located at 252 Main St, South Amboy, NJ 08879 and is currently estimated at $610,460, approximately $317 per square foot. 252 Main St is a home located in Middlesex County with nearby schools including South Amboy Elementary School, South Amboy Middle/High School, and St. Mary Elementary School.
Ownership History
Date
Name
Owned For
Owner Type
Purchase Details
Closed on
Apr 5, 2021
Sold by
Karpowicz Zenon and Karpowicz Edyta
Bought by
Karpowicz Edyta
Current Estimated Value
Purchase Details
Closed on
Mar 11, 2009
Sold by
Karpowicz Zenon and Karpowicz Edyta
Bought by
Karpowicz Zenon and Karpowicz Edyta
Purchase Details
Closed on
Nov 11, 2005
Sold by
Lolo Dolores
Bought by
Karpowicz Zenon and Karpowitz Edyta
Home Financials for this Owner
Home Financials are based on the most recent Mortgage that was taken out on this home.
Original Mortgage
$316,000
Interest Rate
6.07%
Purchase Details
Closed on
Jan 26, 1994
Sold by
Ge Capital Mtg
Bought by
Coleman John and Coleman Dolores
Home Financials for this Owner
Home Financials are based on the most recent Mortgage that was taken out on this home.
Original Mortgage
$109,000
Interest Rate
7.11%
Create a Home Valuation Report for This Property
The Home Valuation Report is an in-depth analysis detailing your home's value as well as a comparison with similar homes in the area
Home Values in the Area
Average Home Value in this Area
Purchase History
| Date | Buyer | Sale Price | Title Company |
|---|---|---|---|
| Karpowicz Edyta | -- | None Available | |
| Karpowicz Edyta | -- | None Listed On Document | |
| Karpowicz Zenon | -- | None Available | |
| Karpowicz Zenon | $395,000 | -- | |
| Coleman John | $115,000 | -- |
Source: Public Records
Mortgage History
| Date | Status | Borrower | Loan Amount |
|---|---|---|---|
| Previous Owner | Karpowicz Zenon | $316,000 | |
| Previous Owner | Coleman John | $109,000 |
Source: Public Records
Tax History Compared to Growth
Tax History
| Year | Tax Paid | Tax Assessment Tax Assessment Total Assessment is a certain percentage of the fair market value that is determined by local assessors to be the total taxable value of land and additions on the property. | Land | Improvement |
|---|---|---|---|---|
| 2025 | $9,627 | $300,000 | $162,300 | $137,700 |
| 2024 | $9,264 | $300,000 | $162,300 | $137,700 |
| 2023 | $9,264 | $300,000 | $162,300 | $137,700 |
| 2022 | $8,802 | $300,000 | $162,300 | $137,700 |
| 2021 | $8,655 | $300,000 | $162,300 | $137,700 |
| 2020 | $8,451 | $300,000 | $162,300 | $137,700 |
| 2019 | $8,316 | $300,000 | $162,300 | $137,700 |
| 2018 | $8,247 | $300,000 | $162,300 | $137,700 |
| 2017 | $8,115 | $300,000 | $162,300 | $137,700 |
| 2016 | $7,911 | $300,000 | $162,300 | $137,700 |
| 2015 | $7,968 | $300,000 | $162,300 | $137,700 |
| 2014 | $7,695 | $300,000 | $162,300 | $137,700 |
Source: Public Records
Map
Nearby Homes