Estimated Value: $304,515 - $365,000
5
Beds
3
Baths
2,436
Sq Ft
$139/Sq Ft
Est. Value
About This Home
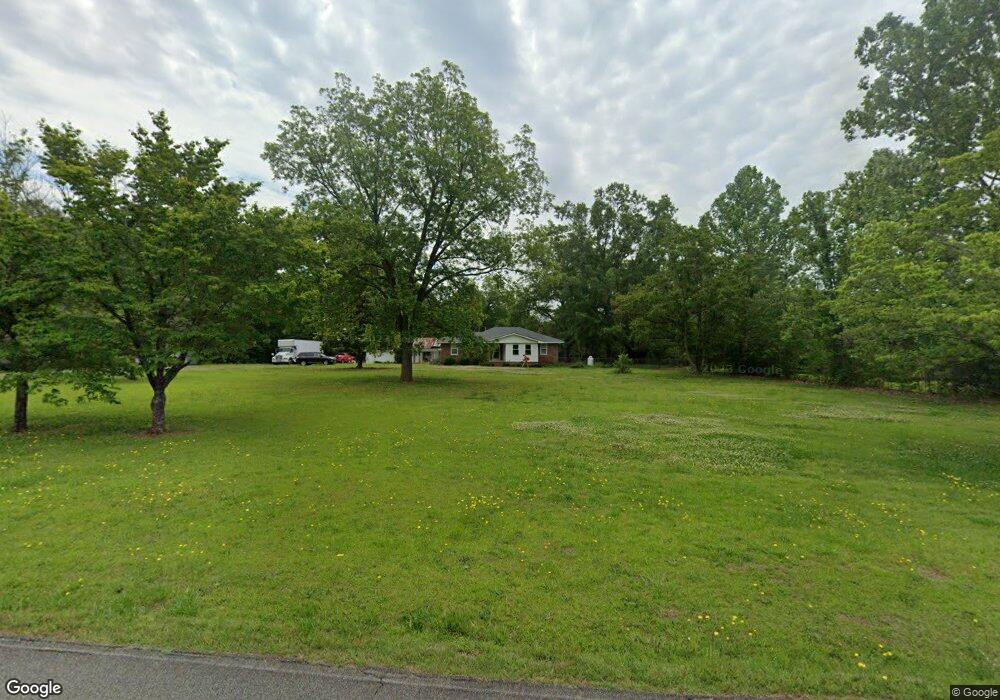
This home is located at 252 Morton Rd, Gray, GA 31032 and is currently estimated at $337,629, approximately $138 per square foot. 252 Morton Rd is a home located in Jones County with nearby schools including Turner Woods Elementary School, Gray Station Middle School, and Jones County High School.
Ownership History
Date
Name
Owned For
Owner Type
Purchase Details
Closed on
Dec 28, 2020
Sold by
Tribble Daniel Earl
Bought by
Ogorman Geoffrey M and Ogorman Ashley M
Current Estimated Value
Home Financials for this Owner
Home Financials are based on the most recent Mortgage that was taken out on this home.
Original Mortgage
$154,640
Outstanding Balance
$137,992
Interest Rate
2.7%
Mortgage Type
New Conventional
Estimated Equity
$199,637
Purchase Details
Closed on
Oct 23, 2012
Sold by
Darsey Virginia Faye Dixon
Bought by
Darsey Virginia Faye Dixon and Tribble Daniel Earl
Purchase Details
Closed on
Oct 12, 2012
Sold by
Darsey Rickey Alan
Bought by
Darsey Virginia Faye Dixon
Create a Home Valuation Report for This Property
The Home Valuation Report is an in-depth analysis detailing your home's value as well as a comparison with similar homes in the area
Home Values in the Area
Average Home Value in this Area
Purchase History
| Date | Buyer | Sale Price | Title Company |
|---|---|---|---|
| Ogorman Geoffrey M | $193,300 | -- | |
| Darsey Virginia Faye Dixon | -- | -- | |
| Darsey Virginia Faye Dixon | -- | -- |
Source: Public Records
Mortgage History
| Date | Status | Borrower | Loan Amount |
|---|---|---|---|
| Open | Ogorman Geoffrey M | $154,640 |
Source: Public Records
Tax History Compared to Growth
Tax History
| Year | Tax Paid | Tax Assessment Tax Assessment Total Assessment is a certain percentage of the fair market value that is determined by local assessors to be the total taxable value of land and additions on the property. | Land | Improvement |
|---|---|---|---|---|
| 2023 | $2,407 | $70,690 | $7,348 | $63,342 |
| 2022 | $2,388 | $70,175 | $6,833 | $63,342 |
| 2021 | $2,391 | $70,175 | $6,833 | $63,342 |
| 2020 | $1,403 | $50,951 | $6,833 | $44,118 |
| 2019 | $1,403 | $50,951 | $6,833 | $44,118 |
| 2018 | $1,403 | $50,951 | $6,833 | $44,118 |
| 2017 | $1,403 | $50,951 | $6,833 | $44,118 |
| 2016 | $1,403 | $50,951 | $6,833 | $44,118 |
| 2015 | $1,338 | $50,951 | $6,833 | $44,118 |
| 2014 | $1,217 | $50,951 | $6,833 | $44,118 |
Source: Public Records
Map
Nearby Homes