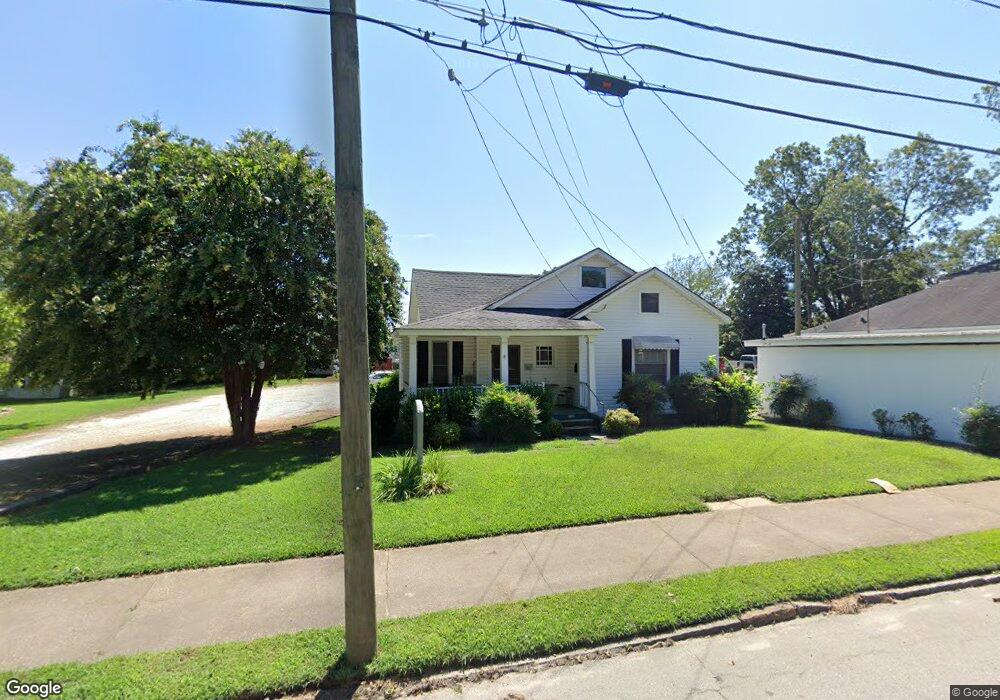
252 N Oliver St Elberton, GA 30635
Estimated Value: $149,000 - $170,000
--
Bed
1
Bath
1,224
Sq Ft
$130/Sq Ft
Est. Value
About This Home
This home is located at 252 N Oliver St, Elberton, GA 30635 and is currently estimated at $159,584, approximately $130 per square foot. 252 N Oliver St is a home located in Elbert County with nearby schools including Elbert County Primary School, Elbert County Elementary School, and Elbert County Middle School.
Ownership History
Date
Name
Owned For
Owner Type
Purchase Details
Closed on
Dec 1, 1987
Current Estimated Value
Purchase Details
Closed on
Nov 1, 1968
Purchase Details
Closed on
Jan 1, 1932
Create a Home Valuation Report for This Property
The Home Valuation Report is an in-depth analysis detailing your home's value as well as a comparison with similar homes in the area
Home Values in the Area
Average Home Value in this Area
Purchase History
| Date | Buyer | Sale Price | Title Company |
|---|---|---|---|
| -- | $20,000 | -- | |
| -- | $7,500 | -- | |
| -- | -- | -- |
Source: Public Records
Tax History Compared to Growth
Tax History
| Year | Tax Paid | Tax Assessment Tax Assessment Total Assessment is a certain percentage of the fair market value that is determined by local assessors to be the total taxable value of land and additions on the property. | Land | Improvement |
|---|---|---|---|---|
| 2024 | $1,208 | $49,083 | $19,807 | $29,276 |
| 2023 | $1,208 | $49,084 | $19,807 | $29,276 |
| 2022 | $1,195 | $48,554 | $19,807 | $28,747 |
| 2021 | $1,204 | $48,554 | $19,807 | $28,747 |
| 2020 | $1,163 | $42,187 | $19,807 | $22,380 |
| 2019 | $1,201 | $42,187 | $19,807 | $22,380 |
| 2018 | $1,103 | $42,187 | $19,807 | $22,380 |
| 2017 | $1,271 | $40,444 | $19,807 | $20,637 |
| 2016 | $1,187 | $40,444 | $19,807 | $20,637 |
| 2015 | -- | $40,444 | $19,807 | $20,637 |
| 2014 | -- | $40,444 | $19,807 | $20,637 |
| 2013 | -- | $42,645 | $22,008 | $20,637 |
Source: Public Records
Map
Nearby Homes
- 346 N Oliver St
- 345 N Oliver St
- 44 Clairmont Ave
- 968 Ext Elbert St
- 89 College Ave
- 243 W Tate St
- 105 S Thomas St
- 214 Campbell St
- 62 Oak St
- 136 Forest Ave
- 1020 Hickory Dr
- 120 S Tusten St
- 245 Edwards St
- 2790 Cedar Creek Rd
- 108 Brookhaven Cir
- 118 Oak Dr
- 196 S Oliver St
- 252 Edwards St
- 0 Sara Jane Dr Unit 10501253
- 170 Lake Forest Dr
- 264 N Oliver St
- 264 N Oliver St
- 246 N Oliver St
- 242 N Oliver St
- 17 Gordon St
- 266 N Oliver St
- 241 N Mcintosh St
- 251 N Oliver St
- 0 Grogan Cir Unit 7529608
- 0 Grogan Cir Unit 9031211
- 270 N Oliver St
- 245 N Oliver St
- 241 N Oliver St
- 234 N Oliver St
- 265 N Oliver St
- 276 N Oliver St
- N N Mcintosh St
- 269 N Oliver St
- 233 N Oliver St Unit 1 A
- 233 N Oliver St