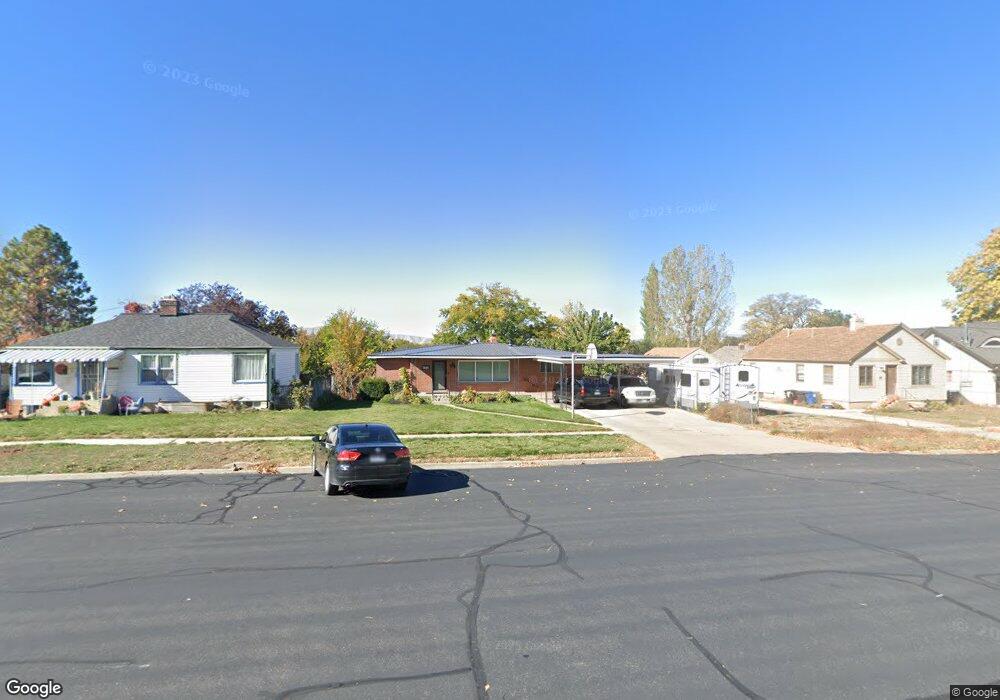
252 S 300 E Spanish Fork, UT 84660
Estimated Value: $455,000 - $535,000
4
Beds
2
Baths
3,280
Sq Ft
$153/Sq Ft
Est. Value
About This Home
This home is located at 252 S 300 E, Spanish Fork, UT 84660 and is currently estimated at $502,040, approximately $153 per square foot. 252 S 300 E is a home located in Utah County with nearby schools including Park Elementary School, Spanish Fork Jr High School, and Spanish Fork High School.
Ownership History
Date
Name
Owned For
Owner Type
Purchase Details
Closed on
Nov 1, 2011
Sold by
Taylor Michael Shirl and Shirley H Taylor Trust
Bought by
Allen Ryial C and Allen Nicole S
Current Estimated Value
Home Financials for this Owner
Home Financials are based on the most recent Mortgage that was taken out on this home.
Original Mortgage
$151,070
Outstanding Balance
$104,886
Interest Rate
4.4%
Mortgage Type
FHA
Estimated Equity
$397,154
Purchase Details
Closed on
Oct 28, 2011
Sold by
Taylor Michael Shirl and Shirley H Taylor Trust
Bought by
Allen Ryial C and Allen Nicole S
Home Financials for this Owner
Home Financials are based on the most recent Mortgage that was taken out on this home.
Original Mortgage
$151,070
Outstanding Balance
$104,886
Interest Rate
4.4%
Mortgage Type
FHA
Estimated Equity
$397,154
Purchase Details
Closed on
Mar 17, 2004
Sold by
Taylor Shirley H
Bought by
Taylor Shirley H
Create a Home Valuation Report for This Property
The Home Valuation Report is an in-depth analysis detailing your home's value as well as a comparison with similar homes in the area
Home Values in the Area
Average Home Value in this Area
Purchase History
| Date | Buyer | Sale Price | Title Company |
|---|---|---|---|
| Allen Ryial C | -- | Title West Spanish Fork | |
| Allen Ryial C | -- | Title West Spanish Fork | |
| Taylor Shirley H | -- | -- |
Source: Public Records
Mortgage History
| Date | Status | Borrower | Loan Amount |
|---|---|---|---|
| Open | Allen Ryial C | $151,070 |
Source: Public Records
Tax History
| Year | Tax Paid | Tax Assessment Tax Assessment Total Assessment is a certain percentage of the fair market value that is determined by local assessors to be the total taxable value of land and additions on the property. | Land | Improvement |
|---|---|---|---|---|
| 2025 | $2,266 | $257,565 | -- | -- |
| 2024 | $2,266 | $233,530 | $0 | $0 |
| 2023 | $2,318 | $239,140 | $0 | $0 |
| 2022 | $2,324 | $235,180 | $0 | $0 |
| 2021 | $2,044 | $331,000 | $90,700 | $240,300 |
| 2020 | $1,856 | $292,100 | $75,600 | $216,500 |
| 2019 | $1,687 | $279,300 | $75,600 | $203,700 |
| 2018 | $1,579 | $252,700 | $75,600 | $177,100 |
| 2017 | $1,464 | $126,005 | $0 | $0 |
| 2016 | $1,285 | $109,065 | $0 | $0 |
| 2015 | $1,163 | $97,570 | $0 | $0 |
| 2014 | $1,060 | $89,210 | $0 | $0 |
Source: Public Records
Map
Nearby Homes
- 844 S 200 E Unit 4 -201
- 390 S 300 E
- 573 E 300 S
- 296 S St Unit 20
- 2583 E 300 S Unit 21
- 277 S 700 E
- 284 N 400 E
- 237 E 850 S
- 837 S 200 E Unit 5-303
- 837 S 200 E Unit 5-202
- 837 S 200 E Unit 5-201
- 837 S 200 E Unit 5-203
- 837 S 200 E Unit 5-301
- 134 W 700 S
- 721 S 110 W
- 272 E 850 S Unit 7-204
- 272 E 850 S Unit 7-203
- 272 E 850 S Unit 7-201
- 272 E 850 S Unit 7-304
- 216 E 850 S Unit 6-204
Your Personal Tour Guide
Ask me questions while you tour the home.