252 Shipp Rd Talbotton, GA 31827
Estimated Value: $373,000 - $747,072
3
Beds
3
Baths
2,592
Sq Ft
$216/Sq Ft
Est. Value
About This Home
This home is located at 252 Shipp Rd, Talbotton, GA 31827 and is currently estimated at $560,036, approximately $216 per square foot. 252 Shipp Rd is a home with nearby schools including Central School.
Ownership History
Date
Name
Owned For
Owner Type
Purchase Details
Closed on
Jan 30, 2017
Sold by
Up Shipp Creek Llc
Bought by
Fish Anton D and Fish Melissa Terry
Current Estimated Value
Home Financials for this Owner
Home Financials are based on the most recent Mortgage that was taken out on this home.
Original Mortgage
$200,000
Outstanding Balance
$101,499
Interest Rate
4.32%
Mortgage Type
New Conventional
Estimated Equity
$458,537
Purchase Details
Closed on
Jun 14, 2013
Sold by
Mckenna Thomas P
Bought by
Up Shipp Creek Farm Llc
Purchase Details
Closed on
May 30, 2013
Sold by
Mccoy James B
Bought by
Mckenna Thomas P
Purchase Details
Closed on
Mar 23, 2011
Sold by
Mccoy James B
Bought by
Mccoy James B
Purchase Details
Closed on
Jun 26, 2003
Sold by
Mccoy James B and Mccoy Juanita W
Bought by
Trustees Of Juanita W Mccoy Family Livin
Purchase Details
Closed on
Jun 23, 2003
Sold by
Mccoy James B
Bought by
Mccoy James B and Mccoy Juanita W
Create a Home Valuation Report for This Property
The Home Valuation Report is an in-depth analysis detailing your home's value as well as a comparison with similar homes in the area
Home Values in the Area
Average Home Value in this Area
Purchase History
| Date | Buyer | Sale Price | Title Company |
|---|---|---|---|
| Fish Anton D | $258,750 | -- | |
| Up Shipp Creek Farm Llc | -- | -- | |
| Mckenna Thomas P | $225,000 | -- | |
| Mccoy James B | -- | -- | |
| Trustees Of Juanita W Mccoy Family Livin | -- | -- | |
| Trustees Of James B Mccoy Family Living | -- | -- | |
| Mccoy James B | -- | -- |
Source: Public Records
Mortgage History
| Date | Status | Borrower | Loan Amount |
|---|---|---|---|
| Open | Fish Anton D | $200,000 |
Source: Public Records
Tax History Compared to Growth
Tax History
| Year | Tax Paid | Tax Assessment Tax Assessment Total Assessment is a certain percentage of the fair market value that is determined by local assessors to be the total taxable value of land and additions on the property. | Land | Improvement |
|---|---|---|---|---|
| 2024 | $5,341 | $203,602 | $54,554 | $149,048 |
| 2023 | $4,580 | $173,082 | $49,591 | $123,491 |
| 2022 | $3,603 | $117,009 | $47,231 | $69,778 |
| 2021 | $566 | $44,174 | $42,938 | $1,236 |
| 2020 | $583 | $44,556 | $42,938 | $1,618 |
| 2019 | $568 | $43,312 | $41,694 | $1,618 |
| 2018 | $1,304 | $43,312 | $41,694 | $1,618 |
| 2017 | $532 | $43,118 | $41,694 | $1,424 |
| 2016 | $477 | $41,694 | $41,694 | $0 |
| 2015 | -- | $50,380 | $50,380 | $0 |
| 2013 | -- | $75,406 | $75,406 | $0 |
Source: Public Records
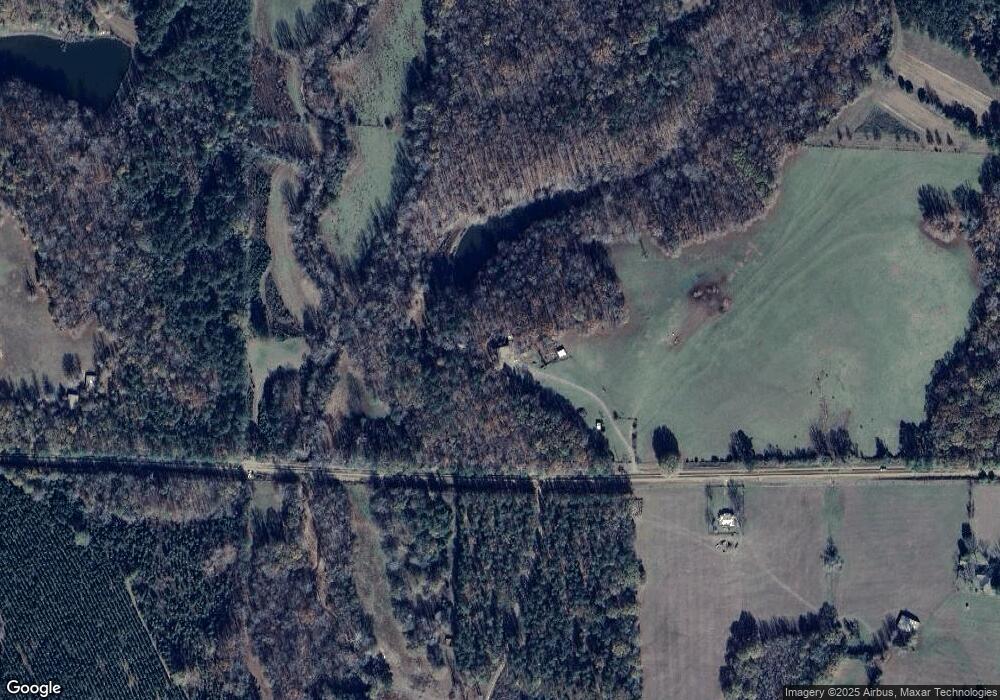
Map
Nearby Homes
- 63 Spring St
- 64 Spring St
- 700 Gun Club Rd
- Tract 2 Dennis Creek Rd
- 0 Dennis Creek Rd
- 1550 Hut Rd
- TRACT 2 Dennis Creek Rd
- 0 Dennis Creek Rd Unit 158992
- 0 Dennis Creek Rd Unit 10436697
- 0 Dennis Creek Rd Unit 158990
- 0 Dennis Creek Rd Unit 22338064
- 0 Dennis Creek Rd Unit 22337227
- 6842 Ga Highway 240 N Unit TRACT 1
- 422 Baker Creek Dr
- 0 Hwy 80 Unit 10638578
- 00Lot3 Mountain Ridge Dr
- 00Lot4 Mountain Ridge Dr
- 475 Rock Church Rd
- 281 Madison St
- 296 N Washington Ave
- 0 Shipp Rd Unit 3244710
- 201 Shipp Rd
- 5988 Geneva Hwy
- 690 Shipp Rd
- 5627 Geneva Hwy
- 5767 Geneva Hwy
- 6282 Geneva Hwy
- 311 Shipp Rd
- 6382 Geneva Hwy
- 5300 Geneva Hwy
- 531 Cook Rd
- 690 Oak Grove Rd
- 5156 Geneva Hwy
- 609 Cook Rd
- 5221 Geneva Hwy
- 1726 Teal Rd
- 2130 Teal Rd
- 350 Daniel Rd
- 1944 Teal Rd
- 6724 Geneva Hwy