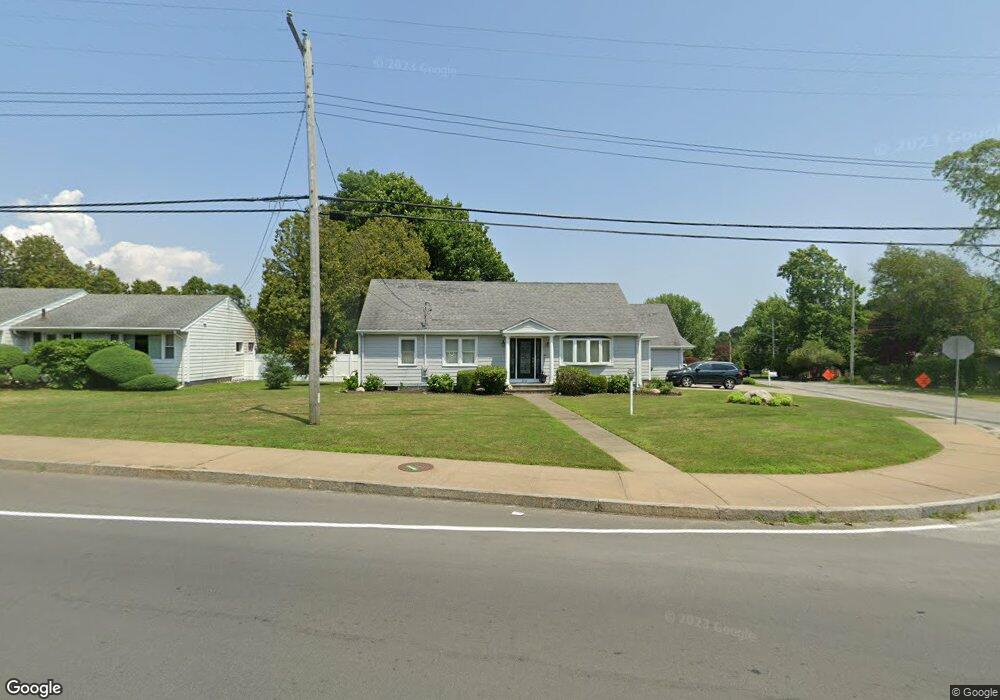
252 Slocum Rd North Dartmouth, MA 02747
Bliss Corner NeighborhoodEstimated Value: $424,000 - $516,000
3
Beds
1
Bath
1,204
Sq Ft
$396/Sq Ft
Est. Value
About This Home
This home is located at 252 Slocum Rd, North Dartmouth, MA 02747 and is currently estimated at $476,268, approximately $395 per square foot. 252 Slocum Rd is a home located in Bristol County with nearby schools including Dartmouth High School, Friends Academy, and Our Sister's School.
Ownership History
Date
Name
Owned For
Owner Type
Purchase Details
Closed on
May 11, 2022
Sold by
Deutra Gabriel A and Deutra Anabela
Bought by
Utra Irt
Current Estimated Value
Purchase Details
Closed on
Jul 28, 1993
Sold by
Goncalves Manuel B and Goncalves Jocelyn Ann
Bought by
Deutra Gabriel A and Deutra Anabela
Home Financials for this Owner
Home Financials are based on the most recent Mortgage that was taken out on this home.
Original Mortgage
$83,000
Interest Rate
7.32%
Mortgage Type
Purchase Money Mortgage
Create a Home Valuation Report for This Property
The Home Valuation Report is an in-depth analysis detailing your home's value as well as a comparison with similar homes in the area
Home Values in the Area
Average Home Value in this Area
Purchase History
| Date | Buyer | Sale Price | Title Company |
|---|---|---|---|
| Utra Irt | -- | None Available | |
| Deutra Gabriel A | $103,000 | -- |
Source: Public Records
Mortgage History
| Date | Status | Borrower | Loan Amount |
|---|---|---|---|
| Previous Owner | Deutra Gabriel A | $83,000 | |
| Previous Owner | Deutra Gabriel A | $7,500 | |
| Previous Owner | Deutra Gabriel A | $7,500 |
Source: Public Records
Tax History Compared to Growth
Tax History
| Year | Tax Paid | Tax Assessment Tax Assessment Total Assessment is a certain percentage of the fair market value that is determined by local assessors to be the total taxable value of land and additions on the property. | Land | Improvement |
|---|---|---|---|---|
| 2025 | $3,357 | $389,900 | $160,100 | $229,800 |
| 2024 | $3,265 | $375,700 | $152,700 | $223,000 |
| 2023 | $3,180 | $346,800 | $141,600 | $205,200 |
| 2022 | $3,088 | $311,900 | $135,400 | $176,500 |
| 2021 | $3,049 | $294,300 | $119,500 | $174,800 |
| 2020 | $2,905 | $279,900 | $119,500 | $160,400 |
| 2019 | $2,889 | $277,800 | $119,500 | $158,300 |
| 2018 | $2,582 | $255,400 | $119,500 | $135,900 |
| 2017 | $2,436 | $243,100 | $112,700 | $130,400 |
| 2016 | $2,458 | $241,900 | $112,700 | $129,200 |
| 2015 | $2,394 | $236,100 | $105,300 | $130,800 |
| 2014 | $2,281 | $223,400 | $95,500 | $127,900 |
Source: Public Records
Map
Nearby Homes
- 29 Elizabeth Ct
- 25 Westwood Dr
- 33 Rosewood Terrace
- 6 Walters Way
- 0 Victoria St Unit 73457953
- 98 Mccabe St
- 1004 Allen St
- 729 Allen St
- 6 Jacob Dr
- 32 Fulton St
- 511 Bedford St
- 6 Strathmore Rd
- 50 Gaywood St
- 5 Samosett Dr
- 49 Stackhouse St
- 3 Mishawum Dr
- 7 Winter St
- 48 Stephen St
- 330 Maple St
- 212 Rockland St