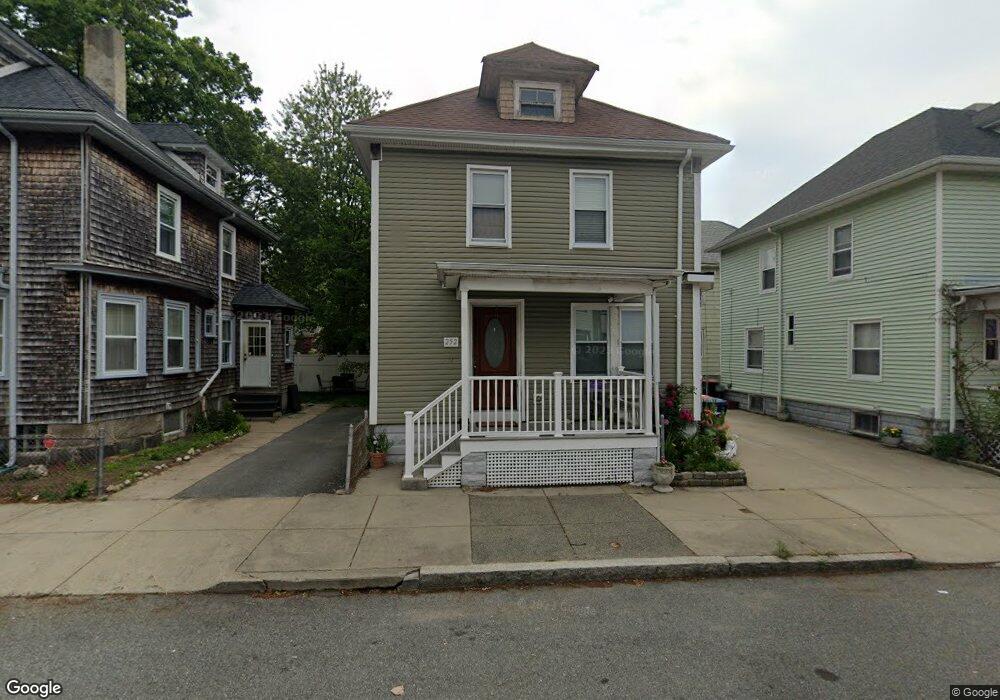
252 Summer St New Bedford, MA 02740
Clasky Park NeighborhoodEstimated Value: $351,000 - $444,000
3
Beds
2
Baths
1,256
Sq Ft
$310/Sq Ft
Est. Value
About This Home
This home is located at 252 Summer St, New Bedford, MA 02740 and is currently estimated at $389,645, approximately $310 per square foot. 252 Summer St is a home located in Bristol County with nearby schools including John Avery Parker, Keith Middle School, and New Bedford High School.
Ownership History
Date
Name
Owned For
Owner Type
Purchase Details
Closed on
Jul 29, 2005
Sold by
Tavares Deanna J
Bought by
Arruda Christine and Amaral David
Current Estimated Value
Home Financials for this Owner
Home Financials are based on the most recent Mortgage that was taken out on this home.
Original Mortgage
$153,000
Interest Rate
5.67%
Mortgage Type
Purchase Money Mortgage
Purchase Details
Closed on
Apr 24, 2002
Sold by
Buckley Marilyn L and Buckley James M
Bought by
Tavares ]Deanna J
Create a Home Valuation Report for This Property
The Home Valuation Report is an in-depth analysis detailing your home's value as well as a comparison with similar homes in the area
Home Values in the Area
Average Home Value in this Area
Purchase History
| Date | Buyer | Sale Price | Title Company |
|---|---|---|---|
| Arruda Christine | $153,000 | -- | |
| Arruda Christine | $153,000 | -- | |
| Tavares ]Deanna J | $98,000 | -- | |
| Tavares ]Deanna J | $98,000 | -- |
Source: Public Records
Mortgage History
| Date | Status | Borrower | Loan Amount |
|---|---|---|---|
| Open | Tavares ]Deanna J | $150,900 | |
| Closed | Tavares ]Deanna J | $153,000 |
Source: Public Records
Tax History Compared to Growth
Tax History
| Year | Tax Paid | Tax Assessment Tax Assessment Total Assessment is a certain percentage of the fair market value that is determined by local assessors to be the total taxable value of land and additions on the property. | Land | Improvement |
|---|---|---|---|---|
| 2025 | $3,586 | $317,100 | $83,800 | $233,300 |
| 2024 | $3,318 | $276,500 | $77,900 | $198,600 |
| 2023 | $3,507 | $245,400 | $65,900 | $179,500 |
| 2022 | $3,046 | $196,000 | $59,900 | $136,100 |
| 2021 | $2,875 | $184,400 | $56,900 | $127,500 |
| 2020 | $2,715 | $168,000 | $56,900 | $111,100 |
| 2019 | $2,594 | $157,500 | $56,900 | $100,600 |
| 2018 | $2,396 | $144,100 | $56,900 | $87,200 |
| 2017 | $2,280 | $136,600 | $55,400 | $81,200 |
| 2016 | $2,175 | $131,900 | $53,900 | $78,000 |
| 2015 | $2,045 | $130,000 | $53,900 | $76,100 |
| 2014 | $1,866 | $123,100 | $52,400 | $70,700 |
Source: Public Records
Map
Nearby Homes