Estimated Value: $399,637 - $566,000
5
Beds
4
Baths
3,320
Sq Ft
$149/Sq Ft
Est. Value
About This Home
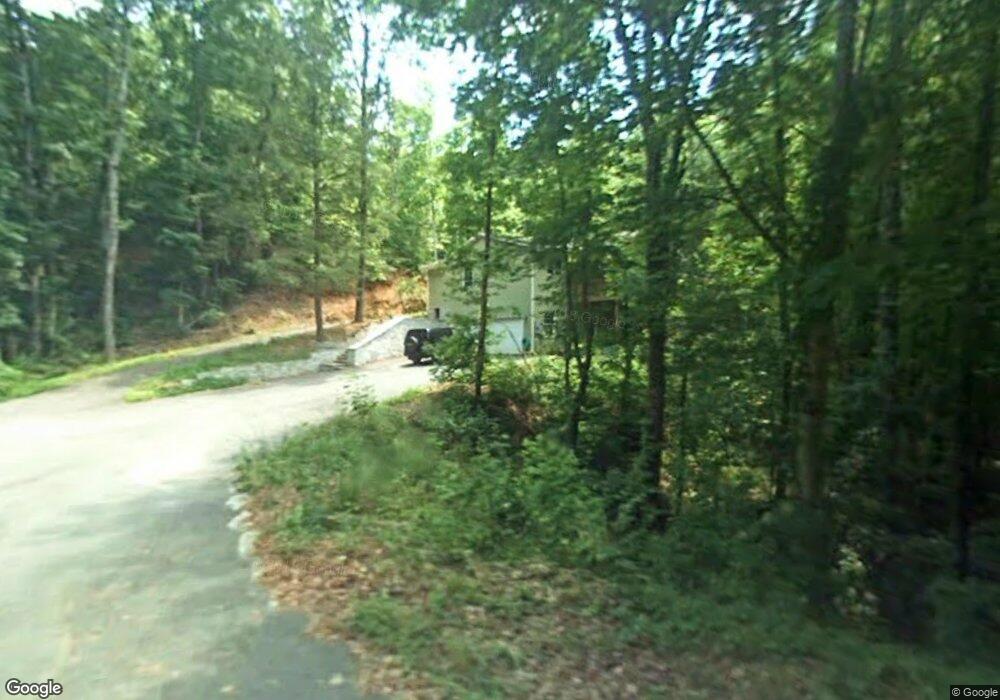
This home is located at 252 Twilight Ln Unit 1, Tiger, GA 30576 and is currently estimated at $495,159, approximately $149 per square foot. 252 Twilight Ln Unit 1 is a home located in Rabun County with nearby schools including Rabun County Primary School and Rabun County High School.
Ownership History
Date
Name
Owned For
Owner Type
Purchase Details
Closed on
Mar 11, 2021
Sold by
Smith Judy Rebecca Robinson Estate
Bought by
Michalak Jack E and Michalak Katatzyna Hawryluk
Current Estimated Value
Purchase Details
Closed on
Mar 31, 2010
Sold by
United Community Bank
Bought by
Smith Judy R
Home Financials for this Owner
Home Financials are based on the most recent Mortgage that was taken out on this home.
Original Mortgage
$174,272
Interest Rate
5.5%
Mortgage Type
FHA
Purchase Details
Closed on
Sep 1, 2009
Sold by
Imbesi Anthony
Bought by
United Community Bank
Purchase Details
Closed on
Oct 1, 2002
Bought by
Imbesi Anthony
Purchase Details
Closed on
Jan 1, 2001
Create a Home Valuation Report for This Property
The Home Valuation Report is an in-depth analysis detailing your home's value as well as a comparison with similar homes in the area
Home Values in the Area
Average Home Value in this Area
Purchase History
| Date | Buyer | Sale Price | Title Company |
|---|---|---|---|
| Michalak Jack E | $299,000 | -- | |
| Michalak Jack E | $299,000 | -- | |
| Smith Judy R | $201,500 | -- | |
| Smith Judy R | $201,500 | -- | |
| United Community Bank | $241,286 | -- | |
| United Community Bank | $241,286 | -- | |
| Imbesi Anthony | $14,300 | -- | |
| -- | -- | -- | |
| -- | -- | -- |
Source: Public Records
Mortgage History
| Date | Status | Borrower | Loan Amount |
|---|---|---|---|
| Previous Owner | United Community Bank | $174,272 |
Source: Public Records
Tax History
| Year | Tax Paid | Tax Assessment Tax Assessment Total Assessment is a certain percentage of the fair market value that is determined by local assessors to be the total taxable value of land and additions on the property. | Land | Improvement |
|---|---|---|---|---|
| 2025 | $2,114 | $138,107 | $10,000 | $128,107 |
| 2024 | $2,054 | $129,972 | $10,000 | $119,972 |
| 2023 | $2,118 | $117,729 | $10,000 | $107,729 |
| 2022 | $2,083 | $113,829 | $10,000 | $103,829 |
| 2021 | $2,060 | $111,850 | $10,000 | $101,850 |
| 2020 | $1,604 | $84,711 | $10,000 | $74,711 |
| 2019 | $1,616 | $84,711 | $10,000 | $74,711 |
| 2018 | $1,621 | $84,711 | $10,000 | $74,711 |
| 2017 | $1,555 | $84,711 | $10,000 | $74,711 |
| 2016 | $1,559 | $84,711 | $10,000 | $74,711 |
| 2015 | $1,572 | $83,831 | $10,000 | $73,831 |
| 2014 | $1,576 | $83,831 | $10,000 | $73,831 |
Source: Public Records
Map
Nearby Homes
- TRACT 3A Big View Ln
- 1131 Joe Davis Rd
- 9 Golf Dr
- 0 Woodall Rd Unit 10728599
- 191 Applewood Dr
- 0 Jericho Ln Unit 10624133
- 5 W Pinecrest Dr
- 441 Summer Ln
- 112 Clayton Dr
- 488 Northridge
- 556 Summer Rd
- 335 S Main St
- 38 Old Blue Trail
- 710 Northridge Dr
- 29 Cool Spring Ln
- 0 High Holly Unit 3HH
- 0 Toole St Unit 10538991
- 0 Toole St Unit 10716992
- 55 Cool Spring Ln
- 0 Turtle Cove Unit 12
- 252 Twilight Ln
- 0 Plainsman Ln Unit LOT 23 10053427
- 269 Twilight Ln
- 88 Plainsman Ln
- 88 Plainsman Ln Unit 20
- 98 Plainsman Ln Unit 19
- 98 Plainsman Ln
- 159 Twilight Ln
- 0 Plainsman Unit 8955143
- 0 Plainsman Unit 24 8955165
- 158 Twilight Ln
- 285 Twilight Ln
- 100 Plainsman Ln
- 104 Plainsman Ln
- 102 Plainsman Ln
- 108 Plainsman Ln
- 108 Plainsman Ln Unit 22
- 9 Bennett Dr
- 435 Twilight Ln
- 119 Bennett Dr
Your Personal Tour Guide
Ask me questions while you tour the home.