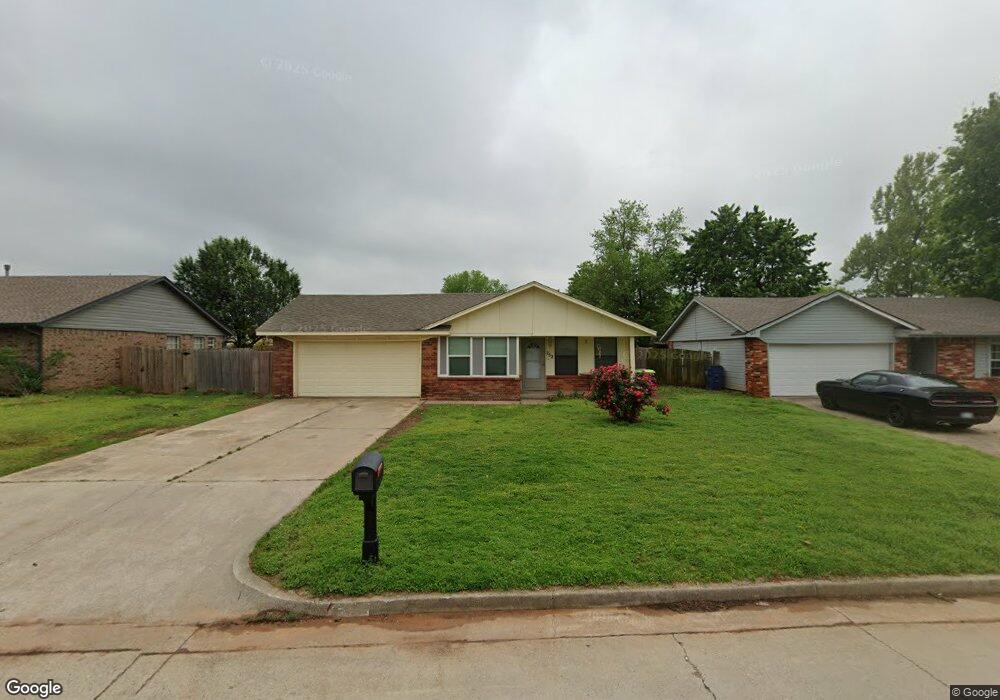
252 W Maple Branch Way Mustang, OK 73064
Estimated Value: $180,000 - $192,000
3
Beds
2
Baths
1,192
Sq Ft
$157/Sq Ft
Est. Value
About This Home
This home is located at 252 W Maple Branch Way, Mustang, OK 73064 and is currently estimated at $186,654, approximately $156 per square foot. 252 W Maple Branch Way is a home located in Canadian County with nearby schools including Mustang Centennial Elementary School, Mustang Horizon Intermediate School, and Mustang Middle School.
Ownership History
Date
Name
Owned For
Owner Type
Purchase Details
Closed on
Jun 17, 2016
Sold by
Strickland Joel and Strickland Tammy
Bought by
Turner Michael J
Current Estimated Value
Home Financials for this Owner
Home Financials are based on the most recent Mortgage that was taken out on this home.
Original Mortgage
$106,043
Outstanding Balance
$89,297
Interest Rate
5.5%
Mortgage Type
FHA
Estimated Equity
$97,357
Purchase Details
Closed on
Jul 21, 2004
Sold by
Misek Bruce A and Misek Deann R
Bought by
Strickland Joel and Strickland Tammy
Home Financials for this Owner
Home Financials are based on the most recent Mortgage that was taken out on this home.
Original Mortgage
$72,000
Interest Rate
6.32%
Purchase Details
Closed on
Dec 12, 1995
Sold by
Jones Jay S and Jones Elizabeth
Purchase Details
Closed on
Sep 26, 1988
Create a Home Valuation Report for This Property
The Home Valuation Report is an in-depth analysis detailing your home's value as well as a comparison with similar homes in the area
Home Values in the Area
Average Home Value in this Area
Purchase History
| Date | Buyer | Sale Price | Title Company |
|---|---|---|---|
| Turner Michael J | $108,000 | Old Republic Title | |
| Strickland Joel | $72,000 | -- | |
| -- | $58,000 | -- | |
| -- | $32,000 | -- |
Source: Public Records
Mortgage History
| Date | Status | Borrower | Loan Amount |
|---|---|---|---|
| Open | Turner Michael J | $106,043 | |
| Previous Owner | Strickland Joel | $72,000 |
Source: Public Records
Tax History Compared to Growth
Tax History
| Year | Tax Paid | Tax Assessment Tax Assessment Total Assessment is a certain percentage of the fair market value that is determined by local assessors to be the total taxable value of land and additions on the property. | Land | Improvement |
|---|---|---|---|---|
| 2024 | $1,540 | $16,203 | $1,800 | $14,403 |
| 2023 | $1,540 | $15,432 | $1,800 | $13,632 |
| 2022 | $1,484 | $14,697 | $1,800 | $12,897 |
| 2021 | $1,419 | $13,997 | $1,800 | $12,197 |
| 2020 | $1,360 | $13,331 | $1,800 | $11,531 |
| 2019 | $1,295 | $12,696 | $1,800 | $10,896 |
| 2018 | $1,301 | $12,479 | $1,800 | $10,679 |
| 2017 | $1,234 | $11,973 | $1,800 | $10,173 |
| 2016 | $1,175 | $11,379 | $1,800 | $9,579 |
| 2015 | $1,122 | $10,838 | $1,800 | $9,038 |
| 2014 | $1,122 | $10,809 | $1,440 | $9,369 |
Source: Public Records
Map
Nearby Homes
- 606 N Pine Branch Way
- 237 W Pines Way
- 413 W Pines Way
- 0 N Mustang Rd
- 0 N Mustang Rd
- 14842 SW 74th St
- 14900 SW 74th St
- 531 W Shadow Ridge Way
- 3636 Blue Ave
- 3629 Blue Ave
- 3633 Blue Ave
- 3637 Pete St
- 3633 Pete St
- 3632 Blue Ave
- 628 W Alamo Court Way
- 602 W Shadow Ridge Way
- 350 W Elder Dr
- 601 N Chisholm Trail Way
- 1109 N Charlotte Terrace
- 3313 Little Creek Dr
- 248 W Maple Branch Way
- 302 W Maple Branch Way
- 245 W Chantilly Way
- 242 W Maple Branch Way
- 306 W Maple Branch Way
- 241 W Chantilly Way
- 301 W Chantilly Way
- 249 W Maple Branch Way
- 301 W Maple Branch Way
- 237 W Chantilly Way
- 305 W Chantilly Way
- 243 W Maple Branch Way
- 236 W Maple Branch Way
- 305 W Maple Branch Way
- 310 W Maple Branch Way
- 233 W Chantilly Way
- 235 W Maple Branch Way
- 309 W Chantilly Way
- 309 W Maple Branch Way
- 246 W Apple Branch Way