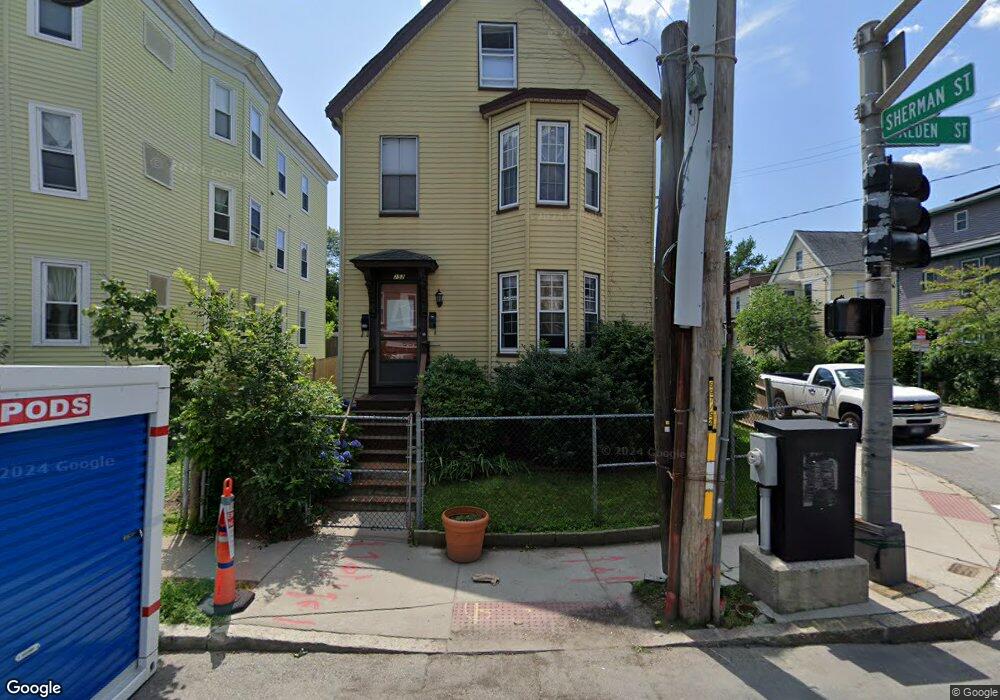
252 Walden St Cambridge, MA 02140
Neighborhood Nine NeighborhoodEstimated Value: $1,261,000 - $2,131,000
3
Beds
3
Baths
1,527
Sq Ft
$1,049/Sq Ft
Est. Value
About This Home
This home is located at 252 Walden St, Cambridge, MA 02140 and is currently estimated at $1,602,334, approximately $1,049 per square foot. 252 Walden St is a home located in Middlesex County with nearby schools including Benjamin Banneker Charter Public School, Cambridge Montessori School, and Cambridge Friends School.
Ownership History
Date
Name
Owned For
Owner Type
Purchase Details
Closed on
Oct 9, 2014
Sold by
Henkin Gary R and Henkin Elaine L
Bought by
Henkin Gary R
Current Estimated Value
Home Financials for this Owner
Home Financials are based on the most recent Mortgage that was taken out on this home.
Original Mortgage
$425,000
Outstanding Balance
$325,824
Interest Rate
4.1%
Mortgage Type
New Conventional
Estimated Equity
$1,276,510
Purchase Details
Closed on
Jan 21, 2005
Sold by
Henkin Gary R
Bought by
Henkin Elaine L and Henkin Gary R
Home Financials for this Owner
Home Financials are based on the most recent Mortgage that was taken out on this home.
Original Mortgage
$271,000
Interest Rate
5.71%
Mortgage Type
Purchase Money Mortgage
Purchase Details
Closed on
Jun 30, 1995
Sold by
Est Masse Frederick A and Masse Myrna D
Bought by
Henkin Gary R
Create a Home Valuation Report for This Property
The Home Valuation Report is an in-depth analysis detailing your home's value as well as a comparison with similar homes in the area
Home Values in the Area
Average Home Value in this Area
Purchase History
| Date | Buyer | Sale Price | Title Company |
|---|---|---|---|
| Henkin Gary R | -- | -- | |
| Henkin Elaine L | -- | -- | |
| Henkin Gary R | $119,500 | -- |
Source: Public Records
Mortgage History
| Date | Status | Borrower | Loan Amount |
|---|---|---|---|
| Open | Henkin Gary R | $425,000 | |
| Previous Owner | Henkin Gary R | $249,950 | |
| Previous Owner | Henkin Elaine L | $271,000 | |
| Previous Owner | Henkin Gary R | $220,000 | |
| Previous Owner | Henkin Gary R | $161,850 |
Source: Public Records
Tax History
| Year | Tax Paid | Tax Assessment Tax Assessment Total Assessment is a certain percentage of the fair market value that is determined by local assessors to be the total taxable value of land and additions on the property. | Land | Improvement |
|---|---|---|---|---|
| 2025 | $5,985 | $942,500 | $350,200 | $592,300 |
| 2024 | $5,598 | $945,600 | $375,200 | $570,400 |
| 2023 | $5,175 | $883,100 | $382,700 | $500,400 |
| 2022 | $4,925 | $832,000 | $379,700 | $452,300 |
| 2021 | $4,776 | $816,400 | $381,000 | $435,400 |
| 2020 | $4,584 | $797,300 | $369,800 | $427,500 |
| 2019 | $4,355 | $733,200 | $330,100 | $403,100 |
| 2018 | $4,102 | $652,200 | $277,900 | $374,300 |
| 2017 | $3,993 | $615,300 | $260,600 | $354,700 |
| 2016 | $3,889 | $556,300 | $225,800 | $330,500 |
| 2015 | $3,854 | $492,800 | $198,500 | $294,300 |
| 2014 | $3,670 | $437,900 | $173,700 | $264,200 |
Source: Public Records
Map
Nearby Homes
- 20 Tierney St Unit 3
- 17 Copley St Unit 2
- 32 Copley St Unit 2
- 140 Huron Ave
- 12 Gray Gardens W Unit 14
- 14-16 Field St
- 316 Concord Ave
- 178 Richdale Ave
- 15 Madison St Unit 1
- 84 Garden St
- 86 Avon Hill St
- 54 Bellis Cir
- 133 Fayerweather St Unit 133
- 151 Sherman St
- 151 Sherman St Unit 151
- 43 Linnaean St Unit 1
- 24 Cambridge Terrace Unit 2
- 119 Appleton St
- 42 Linnaean St Unit 15
- 80 Upland Rd Unit B
- 252 Walden St
- 252 Walden St Unit 2
- 252 Walden St Unit 1 3/4
- 250 Walden St
- 250 Walden St Unit 2
- 250 Walden St
- 250 Walden St Unit 3
- 248 Walden St Unit 1
- 248 Walden St Unit 3
- 40 Sherman St
- 240 Walden St
- 256 Walden St
- 256 Walden St Unit A
- 256 Walden St
- 43 Sherman St Unit 1
- 43 Sherman St Unit 43B
- 43 Sherman St
- 43 Sherman St Unit B
- 38 Sherman St Unit One
- 38 Sherman St Unit Two
Your Personal Tour Guide
Ask me questions while you tour the home.