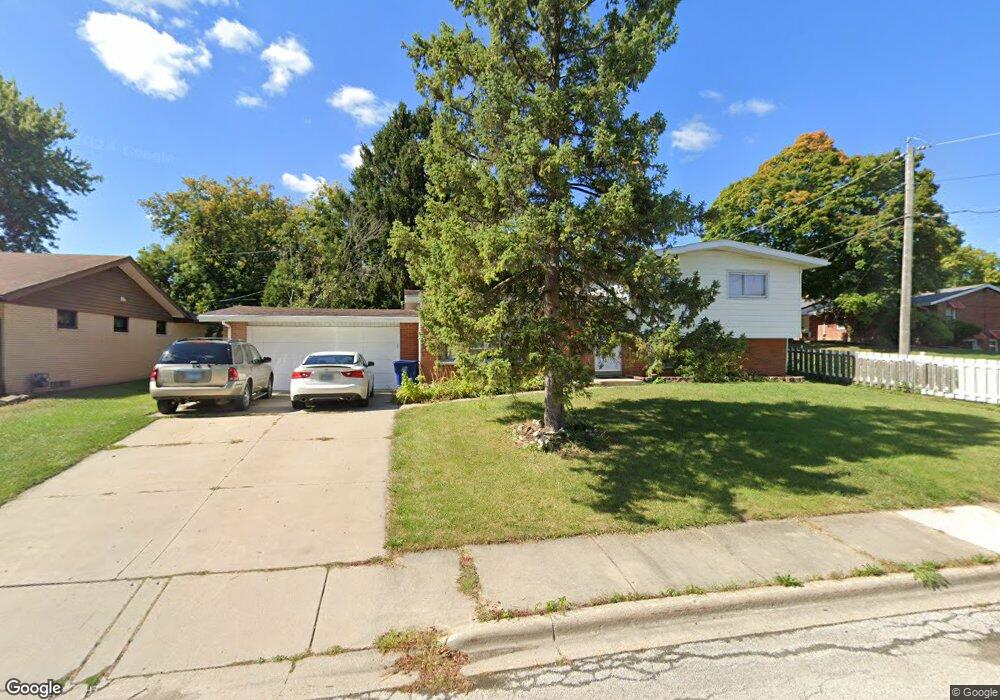
2520 Dunlay Ct Waukegan, IL 60085
West Waukegan NeighborhoodEstimated Value: $224,000 - $251,000
3
Beds
1
Bath
1,171
Sq Ft
$206/Sq Ft
Est. Value
About This Home
This home is located at 2520 Dunlay Ct, Waukegan, IL 60085 and is currently estimated at $240,972, approximately $205 per square foot. 2520 Dunlay Ct is a home located in Lake County with nearby schools including Whittier Elementary School, Robert E. Abbott Middle School, and Waukegan High School.
Ownership History
Date
Name
Owned For
Owner Type
Purchase Details
Closed on
Jul 7, 2010
Sold by
Secretary Of Housing & Urban Development
Bought by
Gabriel Noriel P and Gabriel Elizabeth S
Current Estimated Value
Purchase Details
Closed on
Nov 3, 2008
Sold by
Lopez
Bought by
The Secretary Of Housing & Urban Develop
Purchase Details
Closed on
May 7, 2007
Sold by
Lopez Juan and Lopez Araceli
Bought by
Lopez Araceli
Purchase Details
Closed on
Sep 23, 2005
Sold by
Houston Lawrence and Houston Mary J
Bought by
Lopez Juan and Lopez Araceli
Home Financials for this Owner
Home Financials are based on the most recent Mortgage that was taken out on this home.
Original Mortgage
$195,235
Interest Rate
5.83%
Mortgage Type
FHA
Purchase Details
Closed on
Oct 18, 2002
Sold by
Bank Of Waukegan
Bought by
Houston Lawrence and Houston Mary J
Home Financials for this Owner
Home Financials are based on the most recent Mortgage that was taken out on this home.
Original Mortgage
$85,000
Interest Rate
7.39%
Create a Home Valuation Report for This Property
The Home Valuation Report is an in-depth analysis detailing your home's value as well as a comparison with similar homes in the area
Home Values in the Area
Average Home Value in this Area
Purchase History
| Date | Buyer | Sale Price | Title Company |
|---|---|---|---|
| Gabriel Noriel P | -- | Stewart Title Company | |
| The Secretary Of Housing & Urban Develop | -- | None Available | |
| Lopez Araceli | -- | None Available | |
| Lopez Juan | $198,000 | -- | |
| Houston Lawrence | -- | -- |
Source: Public Records
Mortgage History
| Date | Status | Borrower | Loan Amount |
|---|---|---|---|
| Previous Owner | Lopez Juan | $195,235 | |
| Previous Owner | Houston Lawrence | $85,000 |
Source: Public Records
Tax History Compared to Growth
Tax History
| Year | Tax Paid | Tax Assessment Tax Assessment Total Assessment is a certain percentage of the fair market value that is determined by local assessors to be the total taxable value of land and additions on the property. | Land | Improvement |
|---|---|---|---|---|
| 2024 | $3,973 | $56,509 | $14,200 | $42,309 |
| 2023 | $4,423 | $50,137 | $12,599 | $37,538 |
| 2022 | $4,423 | $51,243 | $12,371 | $38,872 |
| 2021 | $4,765 | $51,707 | $11,639 | $40,068 |
| 2020 | $4,780 | $48,171 | $10,843 | $37,328 |
| 2019 | $4,758 | $44,141 | $9,936 | $34,205 |
| 2018 | $4,810 | $43,583 | $12,054 | $31,529 |
| 2017 | $4,631 | $38,558 | $10,664 | $27,894 |
| 2016 | $4,251 | $33,506 | $9,267 | $24,239 |
| 2015 | $4,052 | $29,988 | $8,294 | $21,694 |
| 2014 | $2,630 | $15,544 | $8,689 | $6,855 |
| 2012 | $1,666 | $16,841 | $9,414 | $7,427 |
Source: Public Records
Map
Nearby Homes
- 0 Brookside Ave
- 24 Washington Terrace
- 102 Baldwin Ave
- 2115 Lydia St
- 615 Tiffany Dr
- 49 S Lewis Ave
- 132 Dorchester Ct
- 1213 Grand Ave
- 2726 W Hidden Glen Dr
- 12601 W Atlantic Ave
- 2116 & 2101 Williamsburg Dr
- 3170 W Monroe St Unit 309
- 1521 Catalpa Ave
- 1416 Hamilton Ct
- 621 N Austin Ave
- 34887 N Austin Ave
- 603 N Austin Ave
- 1005 N Lewis Ave
- 12698 W Grandview Ave
- 12716 W Grandview Ave
- 2524 Dunlay Ct
- 123 N Mcaree Rd
- 121 N Mcaree Rd
- 201 N Mcaree Rd
- 117 N Mcaree Rd
- 2521 Dunlay Ct
- 2528 Dunlay Ct
- 2516 Dunlay Ct
- 2525 Dunlay Ct
- 115 N Mcaree Rd
- 2512 Dunlay Ct
- 111 N Mcaree Rd
- 2529 Dunlay Ct
- 2532 Dunlay Ct
- 109 N Mcaree Rd
- 2428 Dunlay Ct
- 2508 Dunlay Ct
- 2424 Dunlay Ct
- 2533 Dunlay Ct
- 2420 Dunlay Ct