Estimated Value: $203,000 - $249,000
2
Beds
2
Baths
1,325
Sq Ft
$173/Sq Ft
Est. Value
About This Home
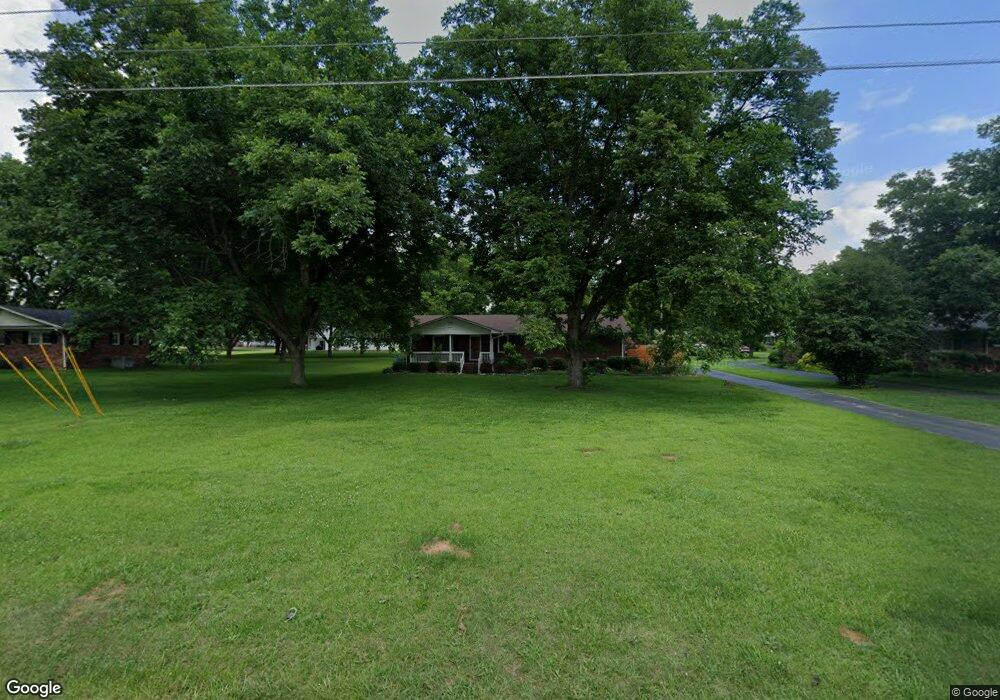
This home is located at 2520 Highway 357, Lyman, SC 29365 and is currently estimated at $229,230, approximately $173 per square foot. 2520 Highway 357 is a home located in Spartanburg County with nearby schools including Lyman Elementary School, D.R. Hill Middle School, and Byrnes Freshman Academy.
Ownership History
Date
Name
Owned For
Owner Type
Purchase Details
Closed on
Mar 24, 2015
Sold by
Carolus Raymond W and Carolus Ethel Kathleen
Bought by
Salters Colin Anthony
Current Estimated Value
Home Financials for this Owner
Home Financials are based on the most recent Mortgage that was taken out on this home.
Original Mortgage
$80,000
Outstanding Balance
$58,495
Interest Rate
2.5%
Mortgage Type
Adjustable Rate Mortgage/ARM
Estimated Equity
$170,735
Purchase Details
Closed on
Dec 12, 2005
Sold by
Carolus Raymond W
Bought by
Carolus Raymond W and Carolus Ethel Kathleen
Purchase Details
Closed on
Mar 4, 2005
Sold by
Crim Katherine J and Jackson Kenneth
Bought by
Carolus Raymond W
Home Financials for this Owner
Home Financials are based on the most recent Mortgage that was taken out on this home.
Original Mortgage
$85,000
Interest Rate
5.6%
Mortgage Type
New Conventional
Create a Home Valuation Report for This Property
The Home Valuation Report is an in-depth analysis detailing your home's value as well as a comparison with similar homes in the area
Home Values in the Area
Average Home Value in this Area
Purchase History
| Date | Buyer | Sale Price | Title Company |
|---|---|---|---|
| Salters Colin Anthony | $100,000 | -- | |
| Carolus Raymond W | -- | -- | |
| Carolus Raymond W | $85,000 | -- |
Source: Public Records
Mortgage History
| Date | Status | Borrower | Loan Amount |
|---|---|---|---|
| Open | Salters Colin Anthony | $80,000 | |
| Previous Owner | Carolus Raymond W | $85,000 |
Source: Public Records
Tax History
| Year | Tax Paid | Tax Assessment Tax Assessment Total Assessment is a certain percentage of the fair market value that is determined by local assessors to be the total taxable value of land and additions on the property. | Land | Improvement |
|---|---|---|---|---|
| 2022 | $743 | $4,600 | $466 | $4,134 |
| 2021 | $733 | $4,600 | $466 | $4,134 |
| 2020 | $714 | $4,600 | $466 | $4,134 |
| 2019 | $714 | $4,600 | $466 | $4,134 |
| 2018 | $679 | $4,600 | $466 | $4,134 |
| 2017 | $569 | $4,000 | $480 | $3,520 |
| 2016 | $543 | $4,000 | $480 | $3,520 |
| 2015 | $175 | $3,036 | $474 | $2,562 |
| 2014 | $170 | $3,036 | $474 | $2,562 |
Source: Public Records
Map
Nearby Homes
- 107 Allison St
- 35 Lyman Lake Rd
- 108 Allison St
- 756 Ruby Golightly Dr
- 760 Ruby Golightly Dr
- 98 Lyman Lake Rd
- 211 Artisan Dr
- 761 Ruby Golightly Dr
- 219 Artisan Dr
- 139 Floyd Meadow Dr
- 235 Artisan Dr
- 239 Artisan Dr
- 242 Artisan Dr
- 250 Artisan Dr
- 254 Artisan Dr
- 246 Artisan Dr
- 1004 Messer Farm Ln
- 278 Henderson Meadow Way
- 1007 Messer Farm Ln
- 227 Ellison Rd
Your Personal Tour Guide
Ask me questions while you tour the home.