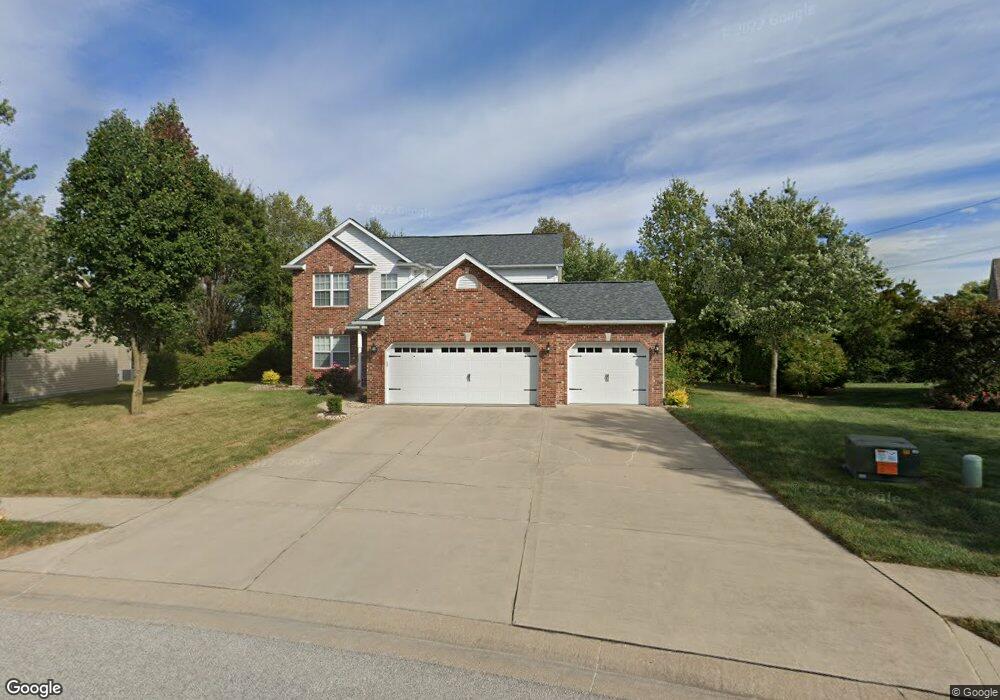
2520 Liberty Dr Maryville, IL 62062
Estimated Value: $383,063 - $406,000
3
Beds
4
Baths
1,196
Sq Ft
$329/Sq Ft
Est. Value
About This Home
This home is located at 2520 Liberty Dr, Maryville, IL 62062 and is currently estimated at $393,516, approximately $329 per square foot. 2520 Liberty Dr is a home located in Madison County with nearby schools including Maryville Elementary School, Dorris Intermediate School, and Collinsville Middle School.
Ownership History
Date
Name
Owned For
Owner Type
Purchase Details
Closed on
Jun 30, 2005
Sold by
H & L Builders Llc
Bought by
Hunsinger Michael A and Hunsinger Michelle L
Current Estimated Value
Home Financials for this Owner
Home Financials are based on the most recent Mortgage that was taken out on this home.
Original Mortgage
$171,120
Outstanding Balance
$89,845
Interest Rate
5.75%
Mortgage Type
Fannie Mae Freddie Mac
Estimated Equity
$303,671
Purchase Details
Closed on
Sep 22, 2004
Sold by
Jfm Development Llc
Bought by
H & L Builders Llc
Home Financials for this Owner
Home Financials are based on the most recent Mortgage that was taken out on this home.
Original Mortgage
$152,050
Interest Rate
4.75%
Mortgage Type
Construction
Create a Home Valuation Report for This Property
The Home Valuation Report is an in-depth analysis detailing your home's value as well as a comparison with similar homes in the area
Home Values in the Area
Average Home Value in this Area
Purchase History
| Date | Buyer | Sale Price | Title Company |
|---|---|---|---|
| Hunsinger Michael A | $214,000 | Abstracts & Titles Inc | |
| H & L Builders Llc | $273,750 | Town & Country Title Co |
Source: Public Records
Mortgage History
| Date | Status | Borrower | Loan Amount |
|---|---|---|---|
| Open | Hunsinger Michael A | $171,120 | |
| Previous Owner | H & L Builders Llc | $152,050 |
Source: Public Records
Tax History Compared to Growth
Tax History
| Year | Tax Paid | Tax Assessment Tax Assessment Total Assessment is a certain percentage of the fair market value that is determined by local assessors to be the total taxable value of land and additions on the property. | Land | Improvement |
|---|---|---|---|---|
| 2024 | $7,262 | $114,370 | $21,660 | $92,710 |
| 2023 | $7,262 | $105,860 | $20,050 | $85,810 |
| 2022 | $6,861 | $97,890 | $18,540 | $79,350 |
| 2021 | $6,189 | $91,970 | $17,420 | $74,550 |
| 2020 | $5,586 | $82,630 | $15,640 | $66,990 |
| 2019 | $5,423 | $79,810 | $15,110 | $64,700 |
| 2018 | $5,286 | $75,600 | $14,310 | $61,290 |
| 2017 | $5,263 | $74,100 | $14,030 | $60,070 |
| 2016 | $5,375 | $74,100 | $14,030 | $60,070 |
| 2015 | $5,002 | $72,180 | $13,670 | $58,510 |
| 2014 | $5,002 | $70,490 | $13,670 | $56,820 |
| 2013 | $5,002 | $72,180 | $13,670 | $58,510 |
Source: Public Records
Map
Nearby Homes
- 6020 Keebler Oaks Dr
- 104 Summit Ridge Unit 104
- 2723 Keebler Rd
- 22 Oak Valley Dr
- 54 Oak Leaf Dr
- 2704 Stone Valley Dr
- 2790 Deerfield Dr
- 2708 Fieldstone Dr
- 912 Oakridge Dr
- 1029 Andra Dr
- 1014 Daniel Dr
- 1005 Daniel Dr
- 5 Deer Trail Dr
- 58 Stonebridge Crossing Dr
- 54 Stonebridge Crossing Dr
- 50 Stonebridge Crossing Dr
- 113 Stonebridge Crossing Dr
- 6 Doe Run Trail
- 625 W Country Ln
- 19 Chelsea Rd
- 2516 Liberty Dr
- 2524 Liberty Dr
- 2535 Liberty Dr
- 2512 Liberty Dr
- 2519 Liberty Dr
- 2528 Liberty Dr
- 2515 Liberty Dr
- 2508 Liberty Dr
- 2509 Liberty Dr
- 2532 Liberty Dr
- 2523 Liberty Dr
- 2505 Liberty Dr
- 2504 Liberty Dr
- 2536 Liberty Dr
- 2451 Calico Ln
- 2500 Liberty Dr
- 108 Derby Ln
- 2501 Liberty Dr
- 2540 Liberty Dr
- 2443 Calico Ln