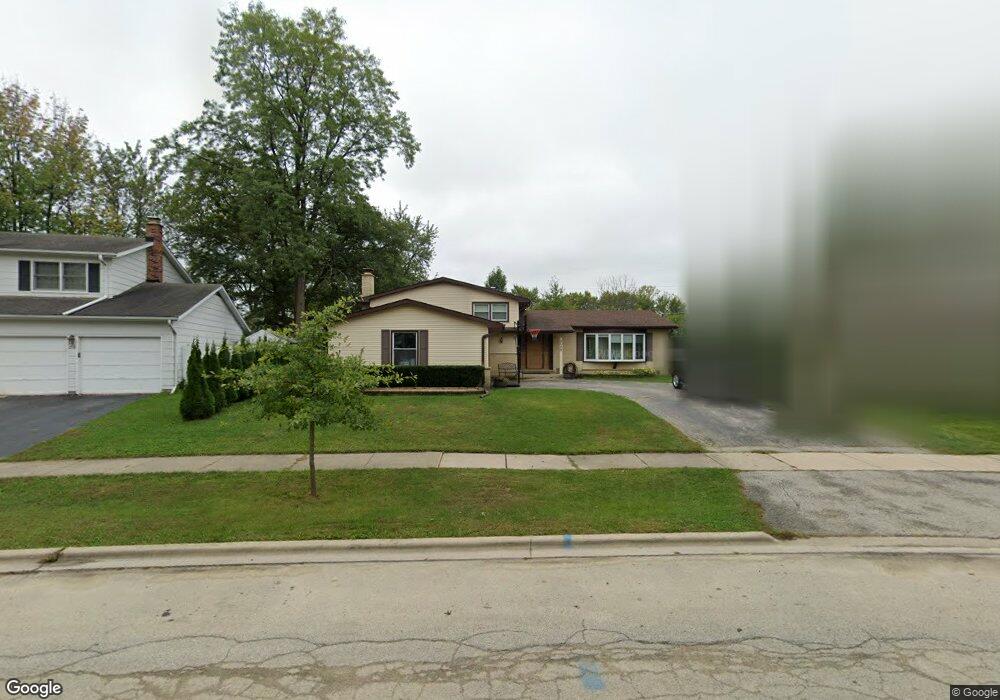
2520 N Walnut Ave Arlington Heights, IL 60004
Berkley Square NeighborhoodEstimated Value: $523,717 - $575,000
4
Beds
3
Baths
1,696
Sq Ft
$321/Sq Ft
Est. Value
About This Home
This home is located at 2520 N Walnut Ave, Arlington Heights, IL 60004 and is currently estimated at $544,239, approximately $320 per square foot. 2520 N Walnut Ave is a home located in Cook County with nearby schools including Ivy Hill Elementary School, Thomas Middle School, and Buffalo Grove High School.
Ownership History
Date
Name
Owned For
Owner Type
Purchase Details
Closed on
Nov 2, 1999
Sold by
Klancnik Karen
Bought by
Soriano Joseph S and Soriano Myrna B
Current Estimated Value
Home Financials for this Owner
Home Financials are based on the most recent Mortgage that was taken out on this home.
Original Mortgage
$150,000
Outstanding Balance
$45,899
Interest Rate
7.78%
Estimated Equity
$498,340
Purchase Details
Closed on
Oct 4, 1999
Sold by
Klancnik Joseph J
Bought by
Klancnik Karen J
Home Financials for this Owner
Home Financials are based on the most recent Mortgage that was taken out on this home.
Original Mortgage
$150,000
Outstanding Balance
$45,899
Interest Rate
7.78%
Estimated Equity
$498,340
Purchase Details
Closed on
Aug 15, 1997
Sold by
Petersen Ruth
Bought by
Klancnik Joseph and Klancnik Karen
Home Financials for this Owner
Home Financials are based on the most recent Mortgage that was taken out on this home.
Original Mortgage
$155,000
Interest Rate
5.5%
Create a Home Valuation Report for This Property
The Home Valuation Report is an in-depth analysis detailing your home's value as well as a comparison with similar homes in the area
Home Values in the Area
Average Home Value in this Area
Purchase History
| Date | Buyer | Sale Price | Title Company |
|---|---|---|---|
| Soriano Joseph S | $230,000 | -- | |
| Klancnik Karen J | -- | -- | |
| Klancnik Joseph | $147,000 | -- |
Source: Public Records
Mortgage History
| Date | Status | Borrower | Loan Amount |
|---|---|---|---|
| Open | Soriano Joseph S | $150,000 | |
| Previous Owner | Klancnik Joseph | $155,000 |
Source: Public Records
Tax History Compared to Growth
Tax History
| Year | Tax Paid | Tax Assessment Tax Assessment Total Assessment is a certain percentage of the fair market value that is determined by local assessors to be the total taxable value of land and additions on the property. | Land | Improvement |
|---|---|---|---|---|
| 2024 | $8,495 | $37,000 | $9,111 | $27,889 |
| 2023 | $8,132 | $37,000 | $9,111 | $27,889 |
| 2022 | $8,132 | $37,000 | $9,111 | $27,889 |
| 2021 | $7,144 | $29,726 | $5,820 | $23,906 |
| 2020 | $7,079 | $29,726 | $5,820 | $23,906 |
| 2019 | $7,042 | $32,993 | $5,820 | $27,173 |
| 2018 | $8,273 | $34,533 | $5,061 | $29,472 |
| 2017 | $8,207 | $34,533 | $5,061 | $29,472 |
| 2016 | $8,137 | $34,533 | $5,061 | $29,472 |
| 2015 | $7,499 | $29,893 | $4,302 | $25,591 |
| 2014 | $7,307 | $29,893 | $4,302 | $25,591 |
| 2013 | $7,619 | $29,893 | $4,302 | $25,591 |
Source: Public Records
Map
Nearby Homes
- 2522 N Chestnut Ave
- 215 W Hintz Rd
- 601 W Rand Rd Unit 207
- 2426 N Kennicott Dr Unit 1B
- 910 W Alleghany Dr Unit 2A
- 2315 N Arlington Heights Rd
- 2410 N Kennicott Dr Unit 2D
- 803 W Burr Oak Dr
- 2340 N Lafayette St
- 504 E Sunset Dr
- 2100 N Ridge Rd
- 2020 N Chestnut Ave
- 1507 W Plymouth Dr
- 1225 Radcliffe Rd Unit 2
- 3222 N Heritage Ln
- 3227 N Heritage Ln
- 18 E Heritage Ct
- 1115 Miller Ln Unit 104
- 1127 Miller Ln Unit 107
- 25 E Palatine Rd Unit 207
- 2522 N Walnut Ave
- 2518 N Walnut Ave
- 2543 N Ridge Ave
- 2535 N Ridge Ave
- 2531 N Ridge Ave
- 2524 N Walnut Ave Unit 6
- 2516 N Walnut Ave
- 2547 N Ridge Ave
- 2527 N Ridge Ave
- 2517 N Walnut Ave
- 2521 N Walnut Ave
- 2551 N Ridge Ave
- 2526 N Walnut Ave
- 2523 N Ridge Ave
- 2514 N Walnut Ave
- 2100 N Ridge Ave
- 2515 N Walnut Ave
- 2555 N Ridge Ave
- 2525 N Walnut Ct
- 2519 N Ridge Ave