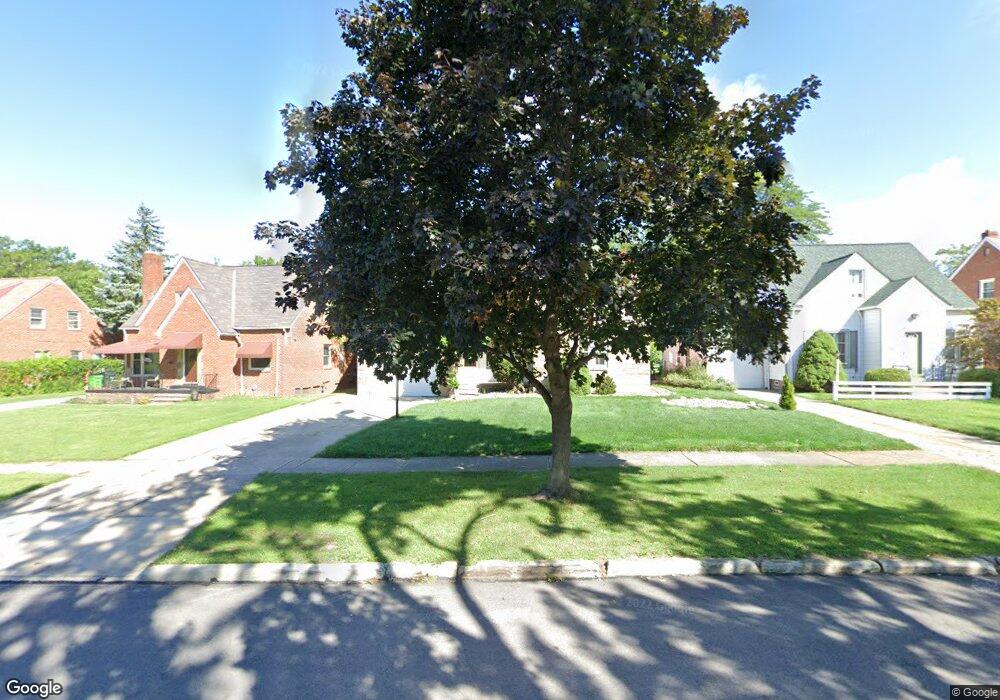
25201 Glenbrook Blvd Euclid, OH 44117
Estimated Value: $231,000 - $274,000
4
Beds
2
Baths
2,442
Sq Ft
$100/Sq Ft
Est. Value
About This Home
This home is located at 25201 Glenbrook Blvd, Euclid, OH 44117 and is currently estimated at $243,704, approximately $99 per square foot. 25201 Glenbrook Blvd is a home located in Cuyahoga County with nearby schools including Thomas Jefferson Elementary School, Euclid Middle School, and Euclid High School.
Ownership History
Date
Name
Owned For
Owner Type
Purchase Details
Closed on
Jun 7, 2017
Sold by
Venesky Richard
Bought by
Kebe Stanley W
Current Estimated Value
Purchase Details
Closed on
Jul 11, 1995
Sold by
Cheung Wilfrid K
Bought by
Gipson Burrell B and Gipson Deborah Y
Home Financials for this Owner
Home Financials are based on the most recent Mortgage that was taken out on this home.
Original Mortgage
$99,000
Interest Rate
7.9%
Mortgage Type
New Conventional
Purchase Details
Closed on
Nov 7, 1990
Sold by
Raicevich Michael J
Bought by
Cheung Wilfred K
Purchase Details
Closed on
Oct 26, 1977
Sold by
Mcdonald Frank L and Lee M
Bought by
Raicevich Michael J
Purchase Details
Closed on
Jan 1, 1975
Bought by
Mcdonald Frank L and Mcdonald Lee M
Create a Home Valuation Report for This Property
The Home Valuation Report is an in-depth analysis detailing your home's value as well as a comparison with similar homes in the area
Home Values in the Area
Average Home Value in this Area
Purchase History
| Date | Buyer | Sale Price | Title Company |
|---|---|---|---|
| Kebe Stanley W | $150 | None Available | |
| Gipson Burrell B | $110,000 | -- | |
| Cheung Wilfred K | $81,500 | -- | |
| Raicevich Michael J | $62,900 | -- | |
| Mcdonald Frank L | -- | -- |
Source: Public Records
Mortgage History
| Date | Status | Borrower | Loan Amount |
|---|---|---|---|
| Previous Owner | Gipson Burrell B | $99,000 |
Source: Public Records
Tax History Compared to Growth
Tax History
| Year | Tax Paid | Tax Assessment Tax Assessment Total Assessment is a certain percentage of the fair market value that is determined by local assessors to be the total taxable value of land and additions on the property. | Land | Improvement |
|---|---|---|---|---|
| 2024 | $4,854 | $71,680 | $10,045 | $61,635 |
| 2023 | $3,839 | $44,910 | $7,840 | $37,070 |
| 2022 | $3,751 | $44,910 | $7,840 | $37,070 |
| 2021 | $4,183 | $44,910 | $7,840 | $37,070 |
| 2020 | $3,965 | $38,710 | $6,760 | $31,960 |
| 2019 | $3,569 | $110,600 | $19,300 | $91,300 |
| 2018 | $3,604 | $38,710 | $6,760 | $31,960 |
| 2017 | $3,841 | $34,480 | $5,430 | $29,050 |
| 2016 | $3,850 | $34,480 | $5,430 | $29,050 |
| 2015 | $3,501 | $34,480 | $5,430 | $29,050 |
| 2014 | $3,501 | $34,480 | $5,430 | $29,050 |
Source: Public Records
Map
Nearby Homes
- 1851 Beverly Hills Dr
- 1865 Idlehurst Dr
- 1836 Braeburn Park Dr
- 25321 Chatworth Dr
- 24691 Hawthorne Dr
- 1620 E 243rd St
- 1823 Sunset Dr
- 1864 Glen Oval
- 1790 Skyline Dr
- 24971 Euclid Ave
- 25151 Euclid Ave
- 2093 Newcome St
- 164 Richmond Rd
- 1498 E 248th St
- 23795 Greenwood Rd
- 23751 Glenbrook Blvd
- 1467 E 250th St
- 1468 E 252nd St
- 1474 E 248th St
- 1552 E 254th St
- 25231 Glenbrook Blvd
- 25171 Glenbrook Blvd
- 25251 Glenbrook Blvd
- 25130 Chatworth Dr
- 25151 Glenbrook Blvd
- 1804 Idlehurst Dr
- 25271 Glenbrook Blvd
- 1800 Idlehurst Dr
- 25140 Chatworth Dr
- 1790 Idlehurst Dr
- 25200 Glenbrook Blvd
- 25150 Chatworth Dr
- 25230 Glenbrook Blvd
- 25170 Glenbrook Blvd
- 1780 Idlehurst Dr
- 25101 Glenbrook Blvd
- 25150 Glenbrook Blvd
- 1770 Idlehurst Dr
- 25270 Glenbrook Blvd
- 25160 Chatworth Dr