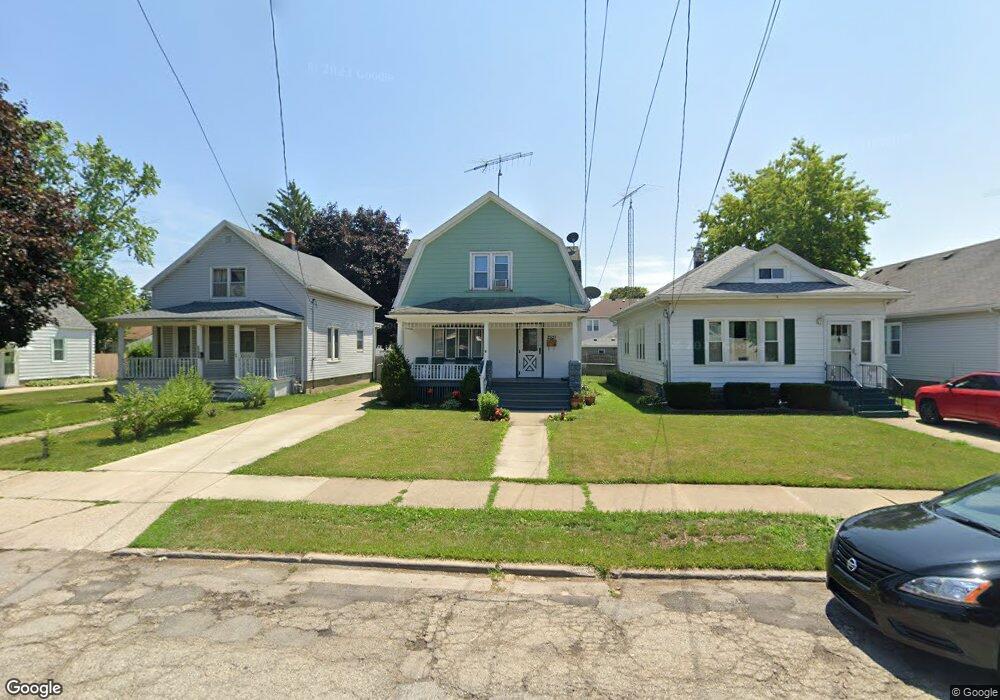
2521 73rd St Kenosha, WI 53143
Saint Joes NeighborhoodEstimated Value: $109,000 - $242,000
4
Beds
2
Baths
1,596
Sq Ft
$125/Sq Ft
Est. Value
About This Home
This home is located at 2521 73rd St, Kenosha, WI 53143 and is currently estimated at $199,323, approximately $124 per square foot. 2521 73rd St is a home located in Kenosha County with nearby schools including Grewenow Elementary School, Lincoln Middle School, and Tremper High School.
Ownership History
Date
Name
Owned For
Owner Type
Purchase Details
Closed on
Dec 6, 2016
Sold by
Federal Home Loan Mortgage Corporation
Bought by
Torres Manuel
Current Estimated Value
Purchase Details
Closed on
Aug 31, 2006
Sold by
Grams Ronald O and Grams Kathleen A
Bought by
Isermann Michael and Isermann Beth
Home Financials for this Owner
Home Financials are based on the most recent Mortgage that was taken out on this home.
Original Mortgage
$147,250
Interest Rate
6.88%
Mortgage Type
New Conventional
Create a Home Valuation Report for This Property
The Home Valuation Report is an in-depth analysis detailing your home's value as well as a comparison with similar homes in the area
Home Values in the Area
Average Home Value in this Area
Purchase History
| Date | Buyer | Sale Price | Title Company |
|---|---|---|---|
| Torres Manuel | $50,000 | -- | |
| Isermann Michael | $155,000 | None Available |
Source: Public Records
Mortgage History
| Date | Status | Borrower | Loan Amount |
|---|---|---|---|
| Previous Owner | Isermann Michael | $147,250 |
Source: Public Records
Tax History
| Year | Tax Paid | Tax Assessment Tax Assessment Total Assessment is a certain percentage of the fair market value that is determined by local assessors to be the total taxable value of land and additions on the property. | Land | Improvement |
|---|---|---|---|---|
| 2025 | $2,538 | $160,800 | $27,800 | $133,000 |
| 2024 | $2,459 | $108,500 | $18,800 | $89,700 |
| 2023 | $2,459 | $108,500 | $18,800 | $89,700 |
| 2022 | $2,497 | $108,500 | $18,800 | $89,700 |
| 2021 | $2,555 | $108,500 | $18,800 | $89,700 |
| 2020 | $2,657 | $108,500 | $18,800 | $89,700 |
| 2019 | $2,548 | $108,500 | $18,800 | $89,700 |
| 2018 | $2,507 | $105,300 | $18,800 | $86,500 |
| 2017 | $3,134 | $105,300 | $18,800 | $86,500 |
| 2016 | $2,780 | $105,300 | $18,800 | $86,500 |
| 2015 | $2,453 | $94,000 | $20,800 | $73,200 |
| 2014 | $2,432 | $94,000 | $20,800 | $73,200 |
Source: Public Records
Map
Nearby Homes
Your Personal Tour Guide
Ask me questions while you tour the home.