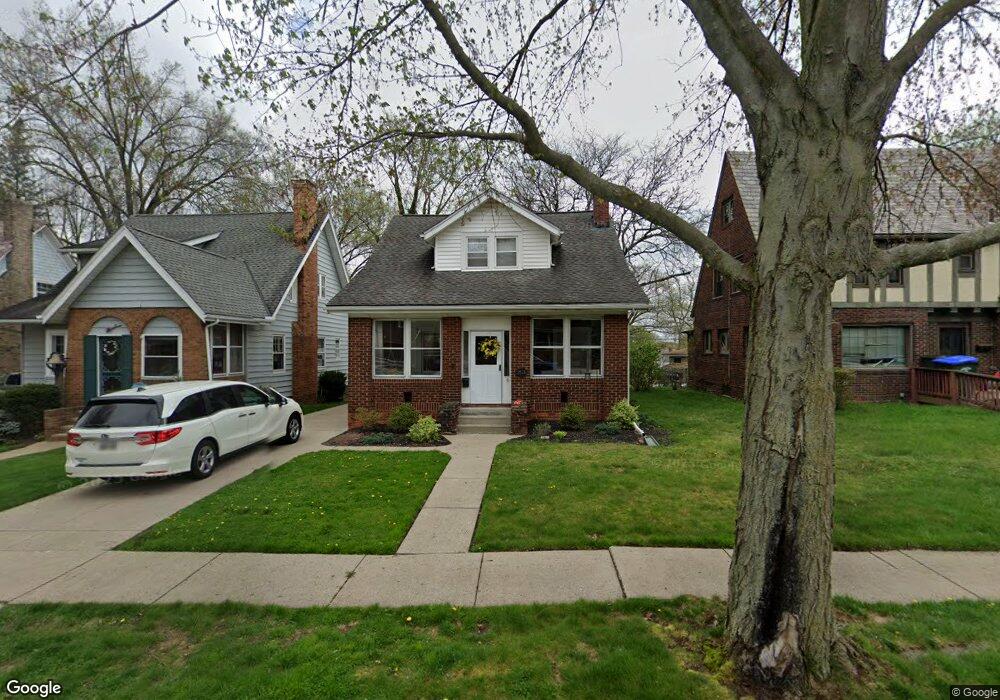
2521 Berk St Cuyahoga Falls, OH 44221
Mud Brook NeighborhoodEstimated Value: $185,000 - $215,000
3
Beds
2
Baths
1,339
Sq Ft
$148/Sq Ft
Est. Value
About This Home
This home is located at 2521 Berk St, Cuyahoga Falls, OH 44221 and is currently estimated at $198,369, approximately $148 per square foot. 2521 Berk St is a home located in Summit County with nearby schools including Dewitt Elementary School, Bolich Middle School, and Cuyahoga Falls High School.
Ownership History
Date
Name
Owned For
Owner Type
Purchase Details
Closed on
Mar 30, 2019
Sold by
Vlahos Scott E
Bought by
Aker Noel R and Vlahos Erin T
Current Estimated Value
Purchase Details
Closed on
Dec 1, 2011
Sold by
Deutsche Bank Trust Company Americas
Bought by
Vlahos Scott E
Purchase Details
Closed on
Nov 21, 2011
Sold by
Johnson Brian D
Bought by
Deutsche Bank Trust Company Americas
Purchase Details
Closed on
Dec 15, 2008
Sold by
Johnson Lisa
Bought by
Johnson Brian D
Purchase Details
Closed on
Oct 30, 2006
Sold by
Hichens Richard E and Hichens Ginger F
Bought by
Johnson Brian D and Johnson Lisa
Home Financials for this Owner
Home Financials are based on the most recent Mortgage that was taken out on this home.
Original Mortgage
$82,800
Interest Rate
6.5%
Mortgage Type
Purchase Money Mortgage
Purchase Details
Closed on
Jul 7, 2005
Sold by
Estate Of James R Schramm
Bought by
Schramm Mary B
Create a Home Valuation Report for This Property
The Home Valuation Report is an in-depth analysis detailing your home's value as well as a comparison with similar homes in the area
Home Values in the Area
Average Home Value in this Area
Purchase History
| Date | Buyer | Sale Price | Title Company |
|---|---|---|---|
| Aker Noel R | $55,000 | None Available | |
| Vlahos Scott E | $63,825 | Omega Title Agency Llc | |
| Deutsche Bank Trust Company Americas | $97,000 | None Available | |
| Johnson Brian D | -- | Attorney | |
| Johnson Brian D | $92,000 | Wigley Title Agency Inc | |
| Schramm Mary B | -- | -- |
Source: Public Records
Mortgage History
| Date | Status | Borrower | Loan Amount |
|---|---|---|---|
| Previous Owner | Johnson Brian D | $82,800 |
Source: Public Records
Tax History Compared to Growth
Tax History
| Year | Tax Paid | Tax Assessment Tax Assessment Total Assessment is a certain percentage of the fair market value that is determined by local assessors to be the total taxable value of land and additions on the property. | Land | Improvement |
|---|---|---|---|---|
| 2025 | $2,957 | $54,772 | $10,728 | $44,044 |
| 2024 | $2,957 | $54,772 | $10,728 | $44,044 |
| 2023 | $2,957 | $54,772 | $10,728 | $44,044 |
| 2022 | $2,724 | $40,978 | $7,945 | $33,033 |
| 2021 | $2,723 | $40,978 | $7,945 | $33,033 |
| 2020 | $2,679 | $40,980 | $7,950 | $33,030 |
| 2019 | $2,363 | $32,200 | $8,150 | $24,050 |
| 2018 | $2,014 | $32,200 | $8,150 | $24,050 |
| 2017 | $1,850 | $32,200 | $8,150 | $24,050 |
| 2016 | $1,852 | $29,910 | $8,150 | $21,760 |
| 2015 | $1,850 | $29,910 | $8,150 | $21,760 |
| 2014 | $1,851 | $29,910 | $8,150 | $21,760 |
| 2013 | $1,740 | $28,360 | $8,150 | $20,210 |
Source: Public Records
Map
Nearby Homes
- 2534 Berk St
- 2470 Whitelaw St
- 2711 Ironwood St
- 2736 Maplewood St
- 2693 Northland St
- 54 Washington Ave
- 279 Birchwood Ave
- 608 Washington Ave
- 2581 8th St
- 2331 5th Ct
- 2443 8th St
- 823 Washington Ave
- 2873 Oakwood Dr
- 2855 6th St
- 2500 9th Ct
- 2890 Bailey Rd
- 2666 10th St
- 116 Munroe Falls Ave
- 2886 Norwood St
- 419 Keenan Ave