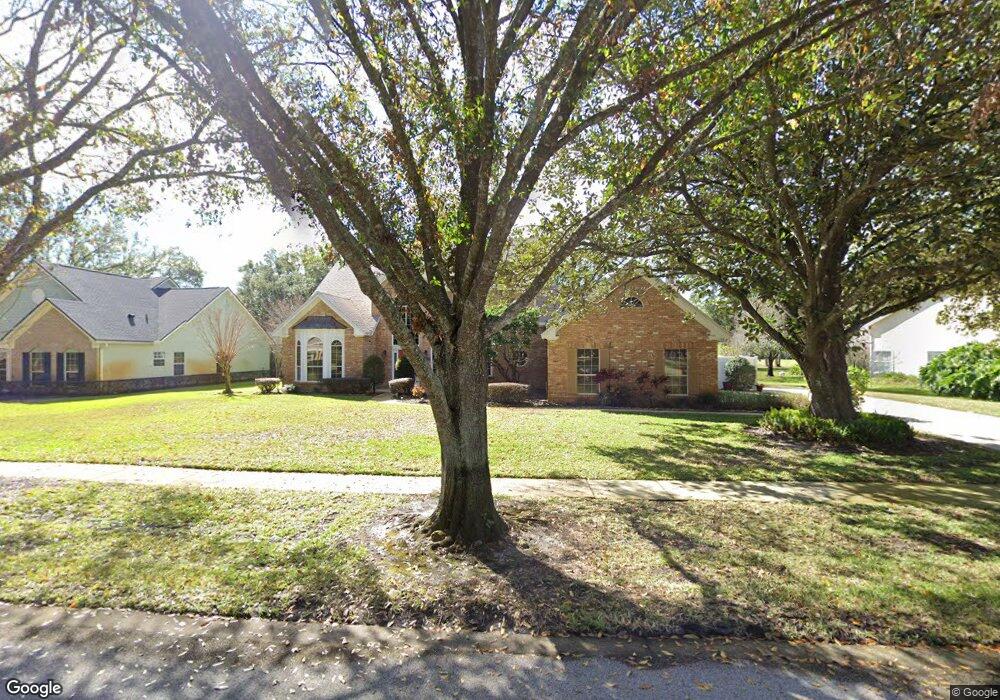
2521 Carter Grove Cir Windermere, FL 34786
Estimated Value: $750,349 - $947,000
3
Beds
3
Baths
2,301
Sq Ft
$366/Sq Ft
Est. Value
About This Home
This home is located at 2521 Carter Grove Cir, Windermere, FL 34786 and is currently estimated at $843,087, approximately $366 per square foot. 2521 Carter Grove Cir is a home located in Orange County with nearby schools including Windermere Elementary School, Gotha Middle School, and Olympia High.
Ownership History
Date
Name
Owned For
Owner Type
Purchase Details
Closed on
May 7, 2019
Sold by
Dichiria Dominick P and Dichiria Jill E
Bought by
Dichiria Family Trust
Current Estimated Value
Purchase Details
Closed on
Jul 30, 2018
Sold by
Dichiria Dominick P and Dichiria Jill E
Bought by
Dichiria Dominick P and Dichiria Jill E
Purchase Details
Closed on
Oct 7, 2014
Sold by
Dichiria Dominick P and Dichiria Jill E
Bought by
Dichiria Family Trust and Dichiria Jill E
Purchase Details
Closed on
Oct 5, 1998
Sold by
Linsea Jack and Linsea Judy P
Bought by
Dichiria Dominick P and Dichiria Jill E
Home Financials for this Owner
Home Financials are based on the most recent Mortgage that was taken out on this home.
Original Mortgage
$200,000
Interest Rate
6.96%
Mortgage Type
New Conventional
Create a Home Valuation Report for This Property
The Home Valuation Report is an in-depth analysis detailing your home's value as well as a comparison with similar homes in the area
Home Values in the Area
Average Home Value in this Area
Purchase History
| Date | Buyer | Sale Price | Title Company |
|---|---|---|---|
| Dichiria Family Trust | -- | Attorney | |
| Dichiria Dominick P | -- | Attorney | |
| Dichiria Family Trust | -- | Attorney | |
| Dichiria Dominick P | $255,000 | -- |
Source: Public Records
Mortgage History
| Date | Status | Borrower | Loan Amount |
|---|---|---|---|
| Open | Dichiria Dominick P | $196,767 | |
| Closed | Dichiria Dominick P | $75,000 | |
| Closed | Dichiria Dominick P | $200,000 |
Source: Public Records
Tax History Compared to Growth
Tax History
| Year | Tax Paid | Tax Assessment Tax Assessment Total Assessment is a certain percentage of the fair market value that is determined by local assessors to be the total taxable value of land and additions on the property. | Land | Improvement |
|---|---|---|---|---|
| 2025 | $5,101 | $336,568 | -- | -- |
| 2024 | $4,930 | $327,083 | -- | -- |
| 2023 | $4,930 | $308,607 | $0 | $0 |
| 2022 | $4,778 | $299,618 | $0 | $0 |
| 2021 | $4,482 | $290,891 | $0 | $0 |
| 2020 | $4,487 | $286,875 | $0 | $0 |
| 2019 | $4,632 | $280,425 | $0 | $0 |
| 2018 | $4,571 | $275,196 | $0 | $0 |
| 2017 | $4,388 | $365,514 | $150,000 | $215,514 |
| 2016 | $4,380 | $360,219 | $150,000 | $210,219 |
| 2015 | $4,448 | $347,322 | $150,000 | $197,322 |
| 2014 | $4,315 | $315,517 | $105,000 | $210,517 |
Source: Public Records
Map
Nearby Homes
- 2125 Kane Park Way
- 11113 Lake Butler Blvd
- 11056 Clipper Ct
- 11002 Lake Butler Blvd
- 3328 Wax Berry Ct
- 2828 Marquesas Ct
- 2844 Marquesas Ct
- 3417 Bay Meadow Ct
- 1803 Glenbay Ct
- 3443 Wild Myrtle Ct
- 2958 Marquesas Ct
- 1821 Windermere Rd
- 2 Oakdale St
- 11312 Shandon Park Way
- 2012 Bellamere Ct
- 801 W 2nd Ave
- 11923 Lake Butler Blvd
- 12001 Lake Butler Blvd
- 409 W 2nd Ave
- 11947 Lake Butler Blvd
- 2515 Carter Grove Cir
- 2527 Carter Grove Cir
- 2509 Carter Grove Cir
- 2533 Carter Grove Cir
- 2520 Carter Grove Cir
- 2508 Carter Grove Cir
- 2514 Carter Grove Cir
- 2629 Stanton Hall Ct
- 2536 Tryon Place
- 2526 Carter Grove Cir
- 2503 Carter Grove Cir
- 2621 Stanton Hall Ct
- 2539 Carter Grove Cir
- 2637 Stanton Hall Ct
- 2542 Tryon Place
- 2512 Tryon Place
- 2532 Carter Grove Cir
- 2613 Stanton Hall Ct
- 2506 Tryon Place
- 2545 Carter Grove Cir