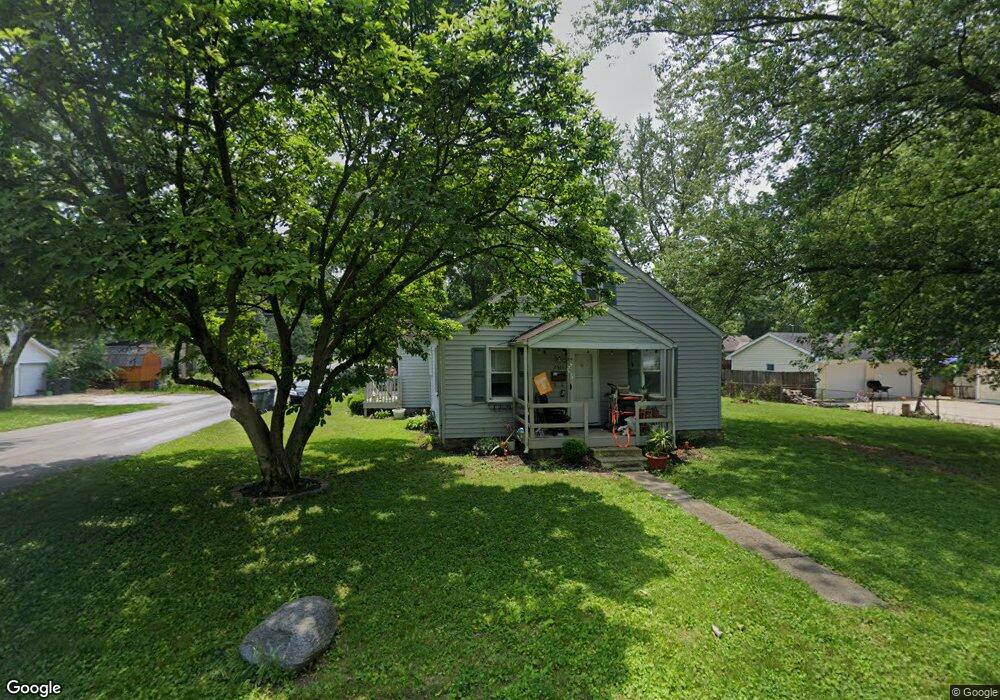
2521 Fowler St Anderson, IN 46012
Estimated Value: $119,000 - $181,000
4
Beds
1
Bath
2,051
Sq Ft
$70/Sq Ft
Est. Value
About This Home
This home is located at 2521 Fowler St, Anderson, IN 46012 and is currently estimated at $143,149, approximately $69 per square foot. 2521 Fowler St is a home located in Madison County with nearby schools including Tenth Street Elementary School, Highland Middle School, and Anderson High School.
Ownership History
Date
Name
Owned For
Owner Type
Purchase Details
Closed on
Mar 14, 2008
Sold by
Jackson Alphonso and Secretary Of Hud And Urban Dev
Bought by
Slattery Jordan P A and Slattery Jennifer L
Current Estimated Value
Home Financials for this Owner
Home Financials are based on the most recent Mortgage that was taken out on this home.
Original Mortgage
$30,000
Outstanding Balance
$18,946
Interest Rate
6.17%
Mortgage Type
New Conventional
Estimated Equity
$124,203
Purchase Details
Closed on
Aug 22, 2007
Sold by
First Horizon Home Loan Corp
Bought by
Secretary Of Hud
Purchase Details
Closed on
Jun 8, 2007
Sold by
Mullanix Steven P
Bought by
First Horizon Home Loan Corp and Ft Mortagage Co
Create a Home Valuation Report for This Property
The Home Valuation Report is an in-depth analysis detailing your home's value as well as a comparison with similar homes in the area
Home Values in the Area
Average Home Value in this Area
Purchase History
| Date | Buyer | Sale Price | Title Company |
|---|---|---|---|
| Slattery Jordan P A | -- | -- | |
| Secretary Of Hud | -- | -- | |
| First Horizon Home Loan Corp | -- | -- |
Source: Public Records
Mortgage History
| Date | Status | Borrower | Loan Amount |
|---|---|---|---|
| Open | Slattery Jordan P A | $30,000 |
Source: Public Records
Tax History Compared to Growth
Tax History
| Year | Tax Paid | Tax Assessment Tax Assessment Total Assessment is a certain percentage of the fair market value that is determined by local assessors to be the total taxable value of land and additions on the property. | Land | Improvement |
|---|---|---|---|---|
| 2025 | $1,380 | $62,100 | $7,900 | $54,200 |
| 2024 | $1,380 | $62,100 | $7,900 | $54,200 |
| 2023 | $1,266 | $56,600 | $7,600 | $49,000 |
| 2022 | $1,262 | $56,400 | $7,500 | $48,900 |
| 2021 | $1,091 | $48,500 | $7,000 | $41,500 |
| 2020 | $1,046 | $46,300 | $6,700 | $39,600 |
| 2019 | $1,022 | $45,200 | $6,700 | $38,500 |
| 2018 | $958 | $41,500 | $6,700 | $34,800 |
| 2017 | $822 | $41,100 | $6,700 | $34,400 |
| 2016 | $822 | $41,100 | $6,700 | $34,400 |
| 2014 | $1,340 | $67,000 | $7,100 | $59,900 |
| 2013 | $1,340 | $67,000 | $7,100 | $59,900 |
Source: Public Records
Map
Nearby Homes
- 2509 Fowler St
- 2526 E 5th St
- 630 Chester St
- 2313 E 5th St
- 2701 E 8th St
- 2405 E 3rd St
- 713 Ellenhurst Dr
- 2208 E 5th St
- 1006 Evergreen Ct
- 916 Alhambra Dr
- 1223 Fairfax St
- 1921 E 10th St
- 1520 Chesterfield Dr
- 1803 E 10th St
- 1606 E 8th St
- 1818 Meramec Dr
- 124 N Mustin Dr
- 1708 Falls Ct
- 239 N Coventry Dr
- 0 S Rangeline Rd Unit MBR22058812