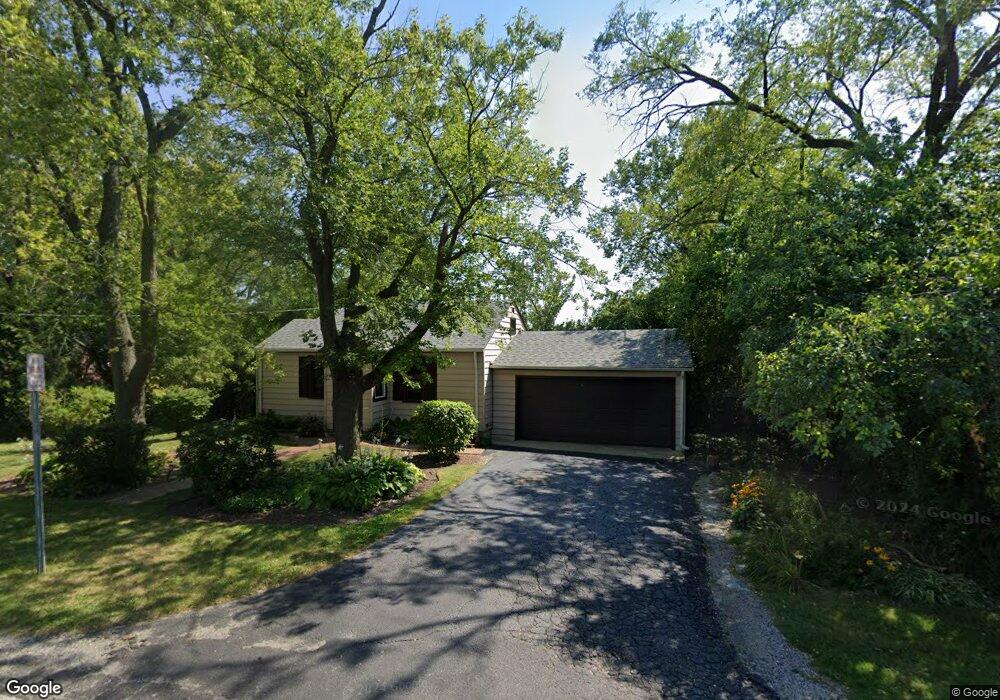
2521 Gray Ct Waukegan, IL 60085
Hidden Glen NeighborhoodEstimated Value: $187,747 - $218,000
2
Beds
1
Bath
729
Sq Ft
$281/Sq Ft
Est. Value
About This Home
This home is located at 2521 Gray Ct, Waukegan, IL 60085 and is currently estimated at $205,187, approximately $281 per square foot. 2521 Gray Ct is a home located in Lake County with nearby schools including Washington Elementary School, Robert E. Abbott Middle School, and Waukegan High School.
Ownership History
Date
Name
Owned For
Owner Type
Purchase Details
Closed on
Jun 23, 2017
Sold by
Calvert Kenneth L and Calvert Stephanie A
Bought by
Rios Ochoa Manuel Romero and Rios Ventura Miriam R
Current Estimated Value
Home Financials for this Owner
Home Financials are based on the most recent Mortgage that was taken out on this home.
Original Mortgage
$26,232,017
Outstanding Balance
$21,955,590
Interest Rate
4.25%
Mortgage Type
FHA
Estimated Equity
-$21,750,403
Create a Home Valuation Report for This Property
The Home Valuation Report is an in-depth analysis detailing your home's value as well as a comparison with similar homes in the area
Home Values in the Area
Average Home Value in this Area
Purchase History
| Date | Buyer | Sale Price | Title Company |
|---|---|---|---|
| Rios Ochoa Manuel Romero | $110,000 | Fidelity National Title |
Source: Public Records
Mortgage History
| Date | Status | Borrower | Loan Amount |
|---|---|---|---|
| Open | Rios Ochoa Manuel Romero | $26,232,017 |
Source: Public Records
Tax History Compared to Growth
Tax History
| Year | Tax Paid | Tax Assessment Tax Assessment Total Assessment is a certain percentage of the fair market value that is determined by local assessors to be the total taxable value of land and additions on the property. | Land | Improvement |
|---|---|---|---|---|
| 2024 | $2,965 | $44,100 | $14,117 | $29,983 |
| 2023 | $3,084 | $39,448 | $12,628 | $26,820 |
| 2022 | $3,084 | $37,543 | $12,910 | $24,633 |
| 2021 | $2,669 | $31,603 | $11,105 | $20,498 |
| 2020 | $2,657 | $29,442 | $10,346 | $19,096 |
| 2019 | $2,622 | $26,978 | $9,480 | $17,498 |
| 2018 | $3,100 | $27,057 | $13,418 | $13,639 |
| 2017 | $3,405 | $23,938 | $11,871 | $12,067 |
| 2016 | $3,214 | $20,801 | $10,315 | $10,486 |
| 2015 | $3,145 | $18,617 | $9,232 | $9,385 |
| 2014 | $3,225 | $19,064 | $8,741 | $10,323 |
| 2012 | $3,997 | $20,655 | $9,471 | $11,184 |
Source: Public Records
Map
Nearby Homes
- 2726 W Hidden Glen Dr
- 12601 W Atlantic Ave
- 2116 & 2101 Williamsburg Dr
- 24 Washington Terrace
- 102 Baldwin Ave
- 49 S Lewis Ave
- 3027 Belvidere Rd
- 0 Brookside Ave
- 671 Oldsmar Ln
- 1521 Catalpa Ave
- 3159 Jeanette Ave
- 132 Dorchester Ct
- 3298 7th St
- 3170 W Monroe St Unit 309
- 819 S Fulton Ave
- 2115 Lydia St
- 1416 Hamilton Ct
- 3285 Meadow Dr
- 615 Tiffany Dr
- 446 S Jackson St
- 2519 Gray Ct
- 2526 Gray Ct
- 2515 Gray Ct
- 2522 Gray Ct
- 2516 Gray Ct
- 2530 Gray Ct
- 2514 Gray Ct
- 420 Keller Ave
- 414 Keller Ave
- 410 Keller Ave
- 416 Keller Ave
- 426 Keller Ave
- 320 Keller Ave
- 2667 W Hidden Glen Dr
- 2664 W Hidden Glen Dr
- 322 Keller Ave
- 316 Keller Ave
- 2675 W Hidden Glen Dr
- 2529 Lucia Ave
- 2533 Lucia Ave