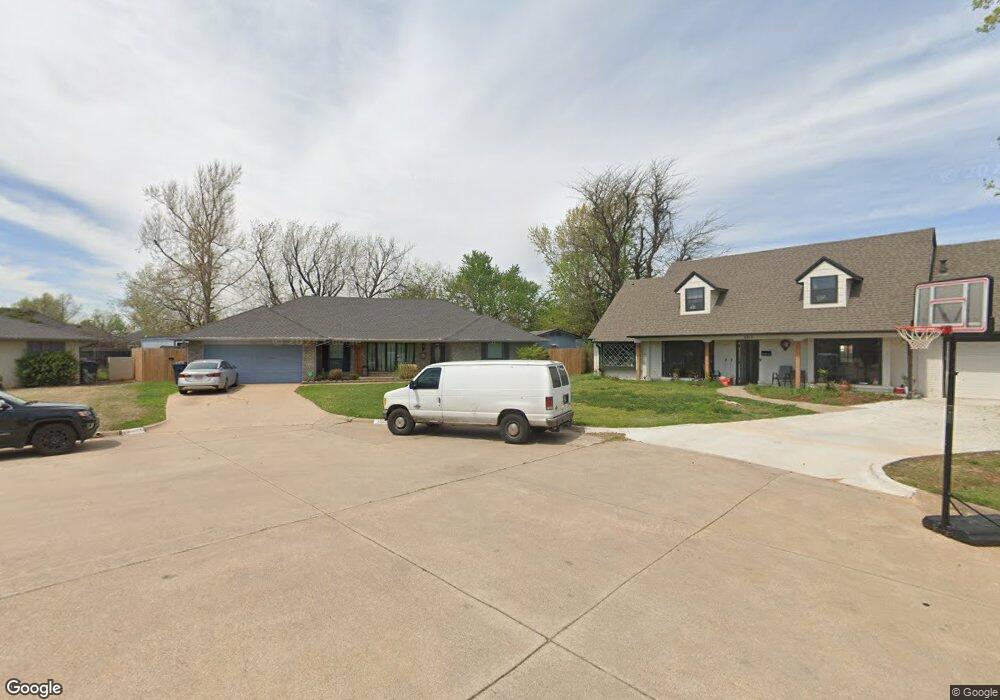
2521 NW 121st St Oklahoma City, OK 73120
Camelot Bel-Aire NeighborhoodEstimated Value: $224,000 - $294,000
3
Beds
3
Baths
2,205
Sq Ft
$121/Sq Ft
Est. Value
About This Home
This home is located at 2521 NW 121st St, Oklahoma City, OK 73120 and is currently estimated at $265,729, approximately $120 per square foot. 2521 NW 121st St is a home located in Oklahoma County with nearby schools including Quail Creek Elementary School, John Marshall Enterprise Middle School, and John Marshall Enterprise High School.
Ownership History
Date
Name
Owned For
Owner Type
Purchase Details
Closed on
Mar 29, 2023
Sold by
Risener Christopher D and Risener Kimberly
Bought by
Risener Christopher D and Risener Kimberly
Current Estimated Value
Purchase Details
Closed on
Dec 24, 2008
Sold by
Risener Chris D and Risner Lacrista A
Bought by
Risener Chris D and Risener Lacrista A
Home Financials for this Owner
Home Financials are based on the most recent Mortgage that was taken out on this home.
Original Mortgage
$162,000
Interest Rate
6.08%
Mortgage Type
FHA
Purchase Details
Closed on
Mar 31, 2005
Sold by
Judge Homer V
Bought by
Risener Chris D
Home Financials for this Owner
Home Financials are based on the most recent Mortgage that was taken out on this home.
Original Mortgage
$115,000
Interest Rate
8.1%
Mortgage Type
Adjustable Rate Mortgage/ARM
Create a Home Valuation Report for This Property
The Home Valuation Report is an in-depth analysis detailing your home's value as well as a comparison with similar homes in the area
Home Values in the Area
Average Home Value in this Area
Purchase History
| Date | Buyer | Sale Price | Title Company |
|---|---|---|---|
| Risener Christopher D | -- | -- | |
| Risener Chris D | -- | First American Title | |
| Risener Chris D | $115,000 | Capitol Abstract & Title Co |
Source: Public Records
Mortgage History
| Date | Status | Borrower | Loan Amount |
|---|---|---|---|
| Previous Owner | Risener Chris D | $162,000 | |
| Previous Owner | Risener Chris D | $115,000 |
Source: Public Records
Tax History Compared to Growth
Tax History
| Year | Tax Paid | Tax Assessment Tax Assessment Total Assessment is a certain percentage of the fair market value that is determined by local assessors to be the total taxable value of land and additions on the property. | Land | Improvement |
|---|---|---|---|---|
| 2024 | $2,211 | $19,570 | $2,882 | $16,688 |
| 2023 | $2,211 | $19,000 | $2,929 | $16,071 |
| 2022 | $2,052 | $18,446 | $3,360 | $15,086 |
| 2021 | $1,990 | $17,909 | $3,272 | $14,637 |
| 2020 | $1,951 | $17,388 | $3,344 | $14,044 |
| 2019 | $1,890 | $16,881 | $3,120 | $13,761 |
| 2018 | $1,746 | $16,390 | $0 | $0 |
| 2017 | $1,789 | $16,779 | $2,923 | $13,856 |
| 2016 | $1,734 | $16,290 | $3,019 | $13,271 |
| 2015 | $1,696 | $15,815 | $3,027 | $12,788 |
| 2014 | $1,634 | $15,356 | $3,027 | $12,329 |
Source: Public Records
Map
Nearby Homes
- 2501 NW 121st St
- 12300 Springwood Dr
- 2400 NW 121st St
- 2341 NW 120th Cir
- 2533 Indian Creek Place
- 12104 Camelot Place
- 2317 NW 119th St
- 2524 NW 116th St
- 11604 N Victoria Dr
- 2821 NW 117th St
- 2316 NW 118th St
- 2525 Lee Ln
- 2728 Camelot Dr
- 2707 Silvertree Dr
- 2501 Patti Place
- 12108 Blue Sage Rd
- 12112 Blue Sage Rd
- 12215 N Pennsylvania Ave
- 2724 Tealwood Dr
- 3008 Red Oak Rd
- 2525 NW 121st St
- 12204 Camelot Dr
- 12208 Camelot Dr
- 12200 Camelot Dr
- 2529 NW 121st St
- 2513 NW 121st St
- 2509 NW 121st St
- 12212 Camelot Dr
- 12201 Camelot Dr
- 2524 NW 121st St
- 12205 Camelot Dr
- 12205 Greystone Terrace
- 12209 Greystone Terrace
- 2520 NW 121st St
- 12209 Camelot Dr
- 2605 NW 121st St
- 2516 NW 121st St
- 2512 NW 121st St
- 12116 Camelot Dr
- 12117 Camelot Dr