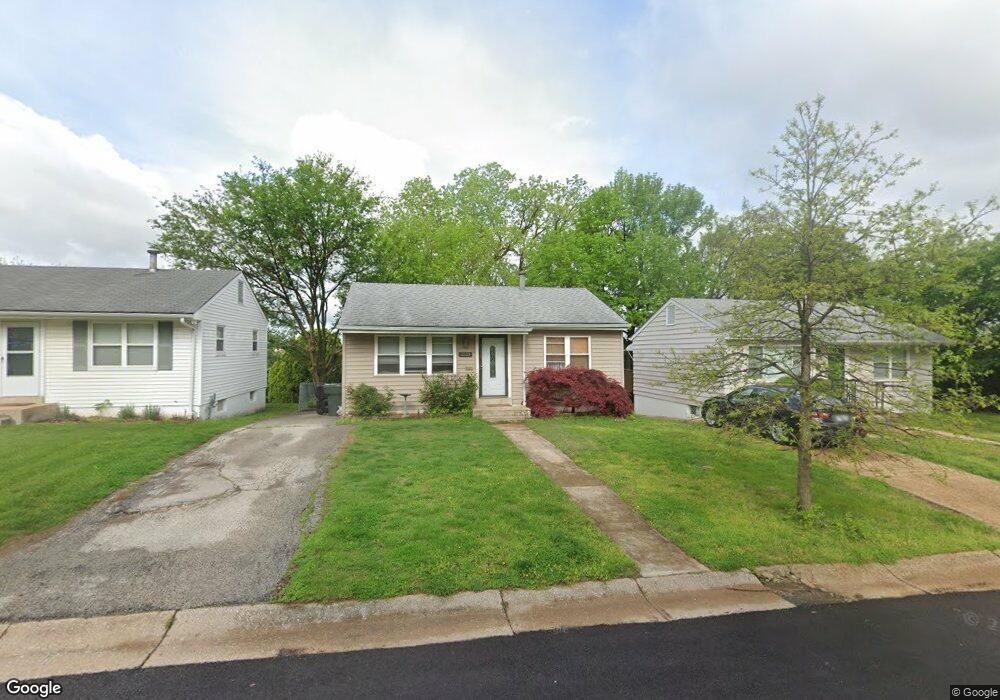
2521 Tamm Ave Saint Louis, MO 63139
Clifton Heights NeighborhoodEstimated Value: $179,000 - $243,000
2
Beds
1
Bath
1,440
Sq Ft
$140/Sq Ft
Est. Value
About This Home
This home is located at 2521 Tamm Ave, Saint Louis, MO 63139 and is currently estimated at $200,973, approximately $139 per square foot. 2521 Tamm Ave is a home located in St. Louis City with nearby schools including Mason Elementary School, Long International Middle School, and Roosevelt High School.
Ownership History
Date
Name
Owned For
Owner Type
Purchase Details
Closed on
Oct 10, 2013
Sold by
Mcnealy Jennifer J and Mcnealy Joshua
Bought by
Johnson Christopher S and Drinka Karri A
Current Estimated Value
Home Financials for this Owner
Home Financials are based on the most recent Mortgage that was taken out on this home.
Original Mortgage
$100,116
Outstanding Balance
$75,404
Interest Rate
4.56%
Mortgage Type
New Conventional
Estimated Equity
$125,569
Purchase Details
Closed on
Apr 30, 2013
Sold by
Hassler James G and Hassler Jennifer J
Bought by
Mcnealy Jennifer J and Hassler Jennifer J
Purchase Details
Closed on
Jan 16, 2007
Sold by
Hassler Jennifer and Hassler James
Bought by
Hassler James and Hassler Jennifer
Purchase Details
Closed on
Aug 27, 2004
Sold by
Covert Lori L and Covert Michael
Bought by
Lukasik Jennifer
Home Financials for this Owner
Home Financials are based on the most recent Mortgage that was taken out on this home.
Original Mortgage
$102,042
Interest Rate
5.95%
Mortgage Type
FHA
Create a Home Valuation Report for This Property
The Home Valuation Report is an in-depth analysis detailing your home's value as well as a comparison with similar homes in the area
Home Values in the Area
Average Home Value in this Area
Purchase History
| Date | Buyer | Sale Price | Title Company |
|---|---|---|---|
| Johnson Christopher S | -- | None Available | |
| Mcnealy Jennifer J | -- | None Available | |
| Hassler James | -- | American Title Inc | |
| Lukasik Jennifer | -- | -- |
Source: Public Records
Mortgage History
| Date | Status | Borrower | Loan Amount |
|---|---|---|---|
| Open | Johnson Christopher S | $100,116 | |
| Previous Owner | Lukasik Jennifer | $102,042 | |
| Closed | Hassler James | $0 |
Source: Public Records
Tax History Compared to Growth
Tax History
| Year | Tax Paid | Tax Assessment Tax Assessment Total Assessment is a certain percentage of the fair market value that is determined by local assessors to be the total taxable value of land and additions on the property. | Land | Improvement |
|---|---|---|---|---|
| 2025 | $2,241 | $31,710 | $2,450 | $29,260 |
| 2024 | $2,132 | $26,440 | $2,450 | $23,990 |
| 2023 | $2,132 | $26,440 | $2,450 | $23,990 |
| 2022 | $1,955 | $23,310 | $2,450 | $20,860 |
| 2021 | $1,952 | $23,310 | $2,450 | $20,860 |
| 2020 | $1,768 | $21,240 | $2,450 | $18,790 |
| 2019 | $1,762 | $21,240 | $2,450 | $18,790 |
| 2018 | $1,597 | $18,640 | $2,450 | $16,190 |
| 2017 | $1,571 | $18,640 | $2,450 | $16,190 |
| 2016 | $1,595 | $18,700 | $2,450 | $16,250 |
| 2015 | $1,447 | $18,700 | $2,450 | $16,250 |
| 2014 | $1,197 | $18,700 | $2,450 | $16,250 |
| 2013 | -- | $15,410 | $2,450 | $12,960 |
Source: Public Records
Map
Nearby Homes
- 6215 Columbia Ave
- 6285 Magnolia Ave
- 6541 Southwest Ave
- 6140 Columbia Ave
- 6133 Magnolia Ave
- 6537 Marmaduke Ave
- 6547 Marmaduke Ave
- 2164 Knox Ave
- 6266 Marmaduke Ave
- 6035 Elizabeth Ave
- 6445 Odell St
- 2817 Knox Ct
- 2022 Knox Ave
- 6568 Odell St
- 6020 Southwest Ave
- 6439 Arsenal St
- 2715 Watson Rd
- 6012 Odell St
- 1912 Kraft St
- 6426 Arsenal St